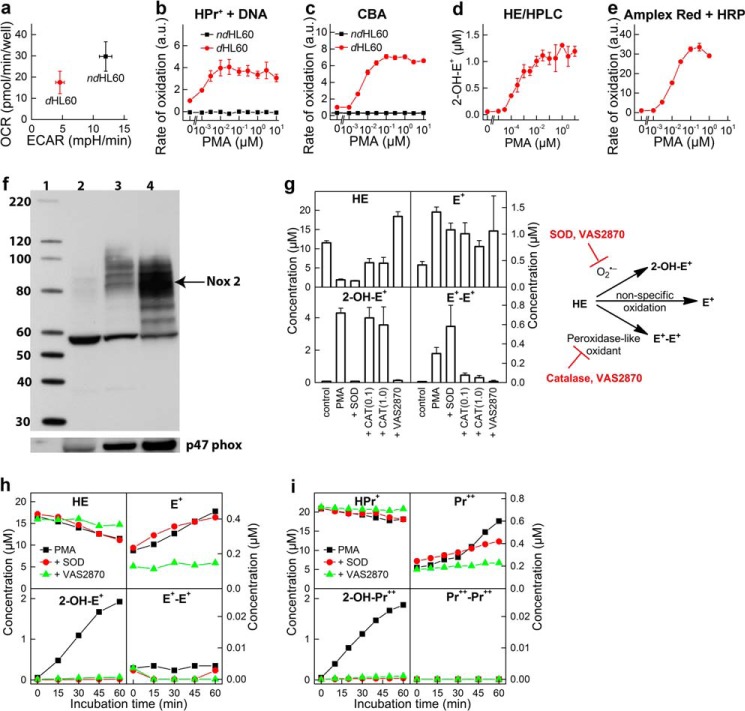
FIGURE 2.
dHL60 model for monitoring the activity of Nox2 NADPH oxidase. a, comparison of the mitochondrial (OCR) and glycolytic (extracellular acidification rate (ECAR)) status of non-differentiated (ndHL60) and differentiated (dHL60) cells. b, HPr+/DNA-based titration with PMA; ndHL60 versus dHL60. c, CBA-based titration with PMA; ndHL60 versus dHL60. d, HE/HPLC-based titration with PMA; dHL60. e, Amplex Red/HRP-based titration with PMA in dHL60. f, expression of protein Nox2 and p47phox in non-differentiated HL60 cells (lane 2) and HL60 cells differentiated with 1.3% DMSO (lane 3) or with 1 μm ATRA (lane 4). Molecular mass markers are shown in lane 1. g, profile of HE oxidation products at high cell density (1 × 10⁶ cells/ml) after incubation of 20 μm HE with dHL60 in HBSS for 1 h. h, kinetics of oxidation of HE (20 μm) in suspension of dHL60 in HBSS at a cell density of 1 × 10⁵ cells/ml. i, same as g, but the probe HPr+ (20 μm) was used. b, c, and e, rate of probe oxidation by dHL60 in the absence of PMA was taken as 1. a.u., arbitrary units. Error bars, S.D.

