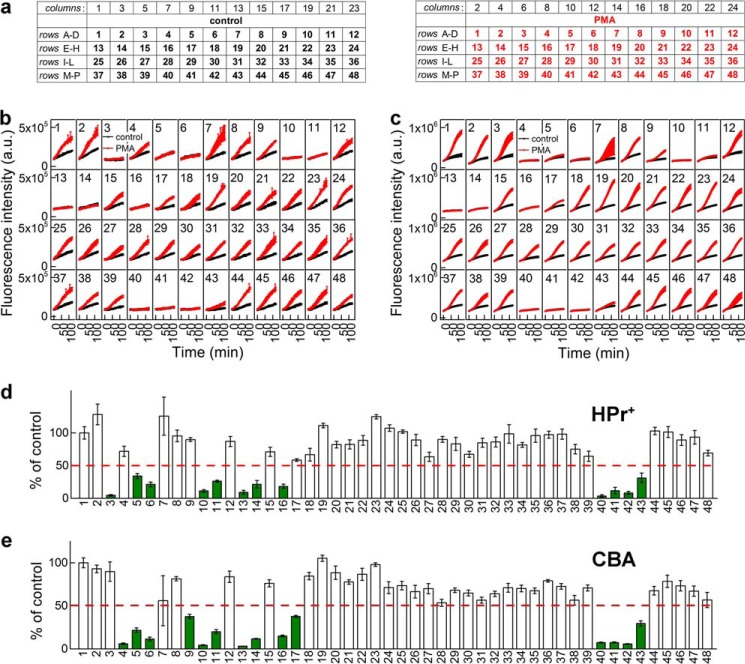
FIGURE 8.
Primary screening of Nox2 inhibitors. a, 384-well plate layout. The numbers correspond to the inhibitors and antioxidants, as defined in Fig. 7. b, effect of inhibitors on the time course of HPr+ oxidation by dHL60 cells without PMA (black symbols) or treated with 1 μm PMA (red symbols). c, same as b, but CBA probe was used. d, quantitative analysis of the effects of inhibitors on the rate of PMA-stimulated oxidation of HPr+. 100% corresponds to the rate of HPr+ oxidation by PMA-stimulated cells in the absence of inhibitors. Positive hits are indicated by green color. e, same as d but with CBA probe. a.u., arbitrary units. Error bars, S.D.

