FIGURE 6.
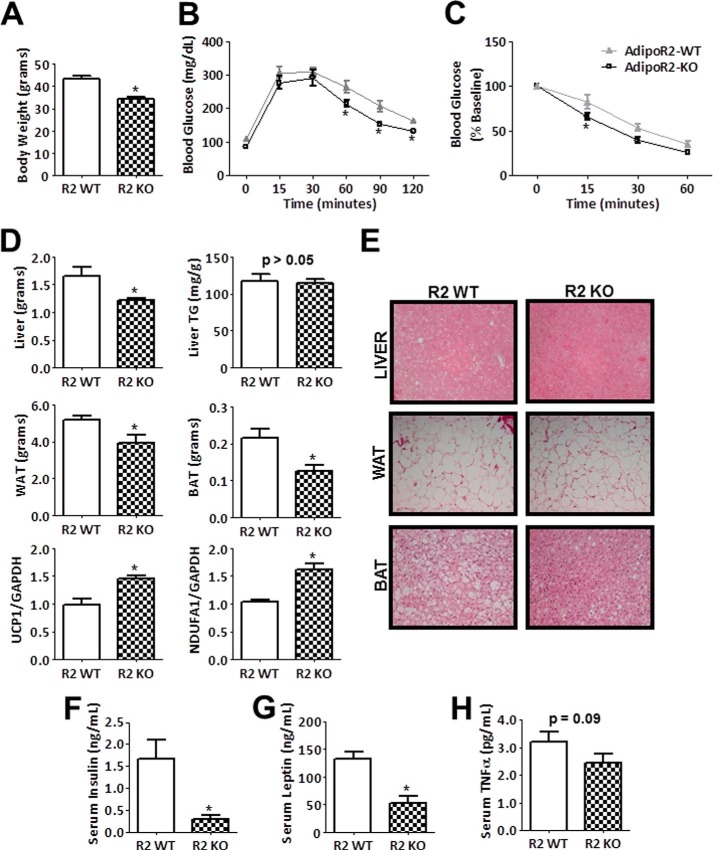
AdipoR2-deficient mice are protected from diet-induced weight gain and metabolic dysfunction. A–C, body weight, glucose tolerance test, and insulin tolerance test results of wild-type and AdipoR2-KO mice fed a high fat/high sucrose diet for 12 weeks. Data are the mean ± S.E. n = 9–11. *, p < 0.05. D, metabolic tissue weights after 16 weeks of diet, triglyceride (TG) content in liver, and relative mRNA expression of UCP1 and NDUFA1 in brown adipose tissue (BAT). Data are the mean ± S.E. n = 4–9. *, p < 0.05. WAT, white reproductive adipose tissue. E, representative images of hematoxylin and eosin-stained liver, white reproductive adipose tissue, interscapular brown adipose tissue. F–H, serum levels of insulin, leptin, and TNF-α. Data are the mean ± S.E. n = 7–9. *, p < 0.05.

