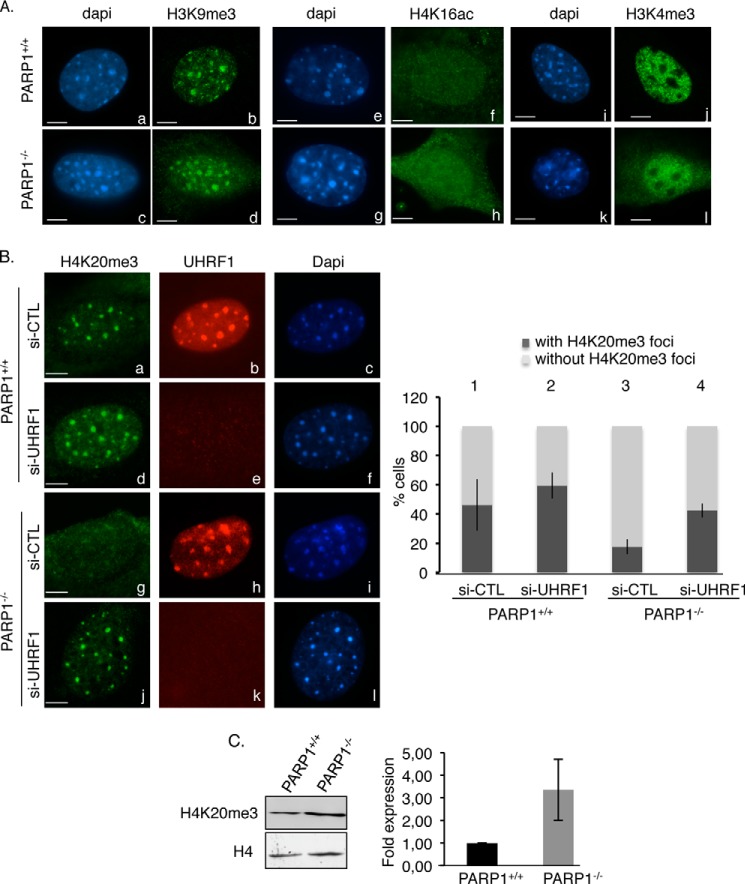
FIGURE 6.
The absence of PARP1 causes reduced staining of the repressive mark H4K20me3 at pericentric regions, which is rescued by the additional depletion of UHRF1. A, PARP1−/− cells display normal H3K9me3, H4K16ac, and H3K4me3 staining onto DAPI-dense heterochromatic regions. Shown are representative immunofluorescence images for the comparative distribution of H3K9me3 (b and d (green)), H4K16ac (f and h (green)), and H3K4me3 (j and l) in PARP1+/+ and PARP1−/− interphase cells. DNA and heterochromatic foci are counterstained with DAPI (a, c, e, g, i, and k). Scale bars: 7 μm. B, left, representative images for the loss of H4K20me3 staining at HC regions in PARP1−/− cells rescued by the additional depletion of UHRF1. Shown is immunofluorescence analysis of H4K20me3 (a, d, g, and j (green)) and UHRF1 (b, e, h, and k (red)) in PARP1+/+ and PARP1−/− cells transfected with either control siRNA (si-CTL) or si-UHRF1. DNA and heterochromatic foci are counterstained with DAPI (c, f, i, and l). Right, the histogram depicts the percentage of cells with or without H4K20me3 staining. An average of 500 cells/cell line were scored in >20 randomly selected fields. Results are averages from three independent experiments. Mean values ± S.D. are indicated. C, the overall expression of H4K20me3 is weakly increased in the PARP1−/− cells. Left, equivalent amounts of acid-extracted histones from PARP1+/+ and PARP1−/− cells were analyzed by Western blotting using an anti-H4K20me3 antibody and an anti-H4 antibody as loading control. Right, the signal intensities of H4K20me3 relative to H4 were measured in three independent experiments using ImageJ. Mean values ± S.D. are indicated.

