FIGURE 5.

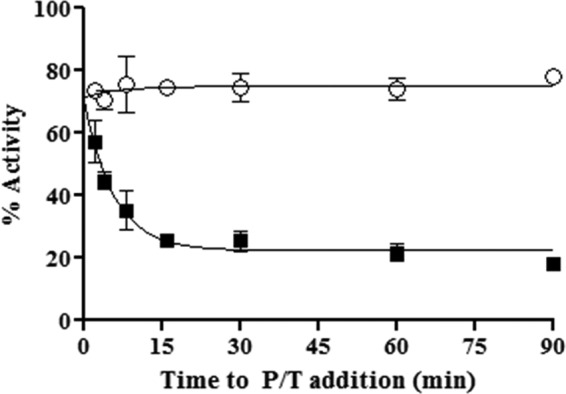
Time course assay showing association of GSK5750 with free enzyme. x axis represents time from the creation of the E-I complex to the addition of primer/template (P/T) substrate for both 50 μm β-thujaplicinol (○) and 0.5 μm GSK5750 (■).

Time course assay showing association of GSK5750 with free enzyme. x axis represents time from the creation of the E-I complex to the addition of primer/template (P/T) substrate for both 50 μm β-thujaplicinol (○) and 0.5 μm GSK5750 (■).