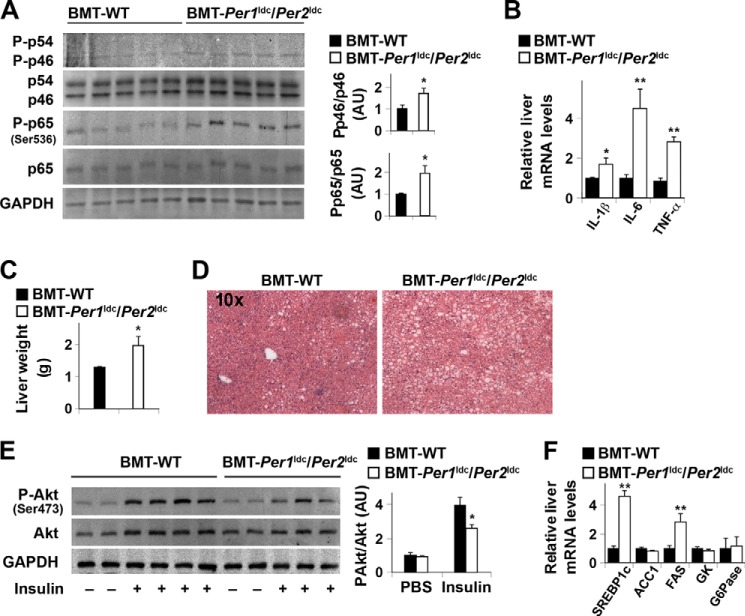
FIGURE 10.
Myeloid cell-specific Per1/2 disruption exacerbates HFD-induced liver inflammatory responses and insulin resistance. Chimeric mice (BMT-WT and BMT-Per1ldc/Per2ldc) were fed an HFD for 12 weeks (n = 6–10). A, liver inflammatory signaling. The levels of total and phosphorylated JNK1 (p46) and NF-κB p65 were examined using Western blot analyses and quantified using densitometry. B, liver levels of proinflammatory cytokine mRNAs. C, liver weight. D, liver histology (H&E staining). E, liver insulin signaling. F, liver mRNA levels of key metabolic genes. For A–F, HFD-fed chimeric mice were fasted for 4 h starting at the same time of the day before tissue collection (A–D and F) or insulin injection (E). For B and F, liver mRNA levels of metabolic genes were quantified using real-time PCR and plotted as relative expression. For E, chimeric mice were given a bolus injection of insulin (1 unit/kg of body weight) or PBS into the portal vein. For bar graphs (A–C, E, and F), data are the means ± S.E. *, p < 0.05; **, p < 0.01 BMT-Per1ldc/Per2ldc versus BMT-WT (A–C) under same condition (insulin in E) for the same gene (F). AU, arbitrary units. GK, glucokinase; ACC1, acetyl-CoA carboxylase 1; G6Pase, glucose-6-phosphatase.

