FIGURE 2.
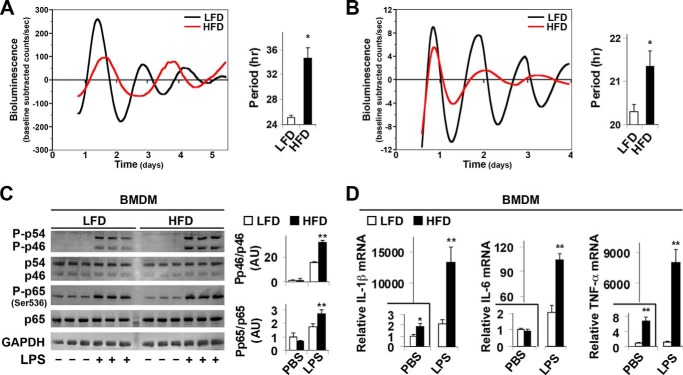
Over-nutrition lengthens the period of clock gene oscillations in adipose tissue SVC and in macrophages and enhances macrophage proinflammatory activation. At 5–6 weeks of age, mPer2Luc mice were fed an HFD or LFD for 12 weeks (n = 5–6). A and B, representative recordings of ensemble PER2::LUC bioluminescence (expressed as detrended base-line-subtracted counts per second) from cultured adipose tissue SVC (A) or BMDM (B). Bar graphs depict group differences in PER2::LUC rhythm period between treatment groups. C, macrophage inflammatory signaling. Before harvest, BMDM were treated with LPS (100 ng/ml) or PBS for 30 min. The levels of JNK1 (p46), phospho-JNK1, NF-κB p65, and phospho-p65 (Ser-536) were examined using Western blot analyses and quantified using densitometry. D, macrophage IL-1β, IL-6, and TNF-α mRNA expression. Before harvest, BMDM were treated with LPS (100 ng/ml) or PBS for 6 h. IL-1β and TNF-α mRNA levels were quantified using real-time PCR and plotted as relative expression. For bar graphs (A–D), data are the means ± S.E. *, p < 0.05; **, p < 0.01 HFD versus LFD (A and B) under the same conditions (PBS or LPS) (C and D).

