FIGURE 3.
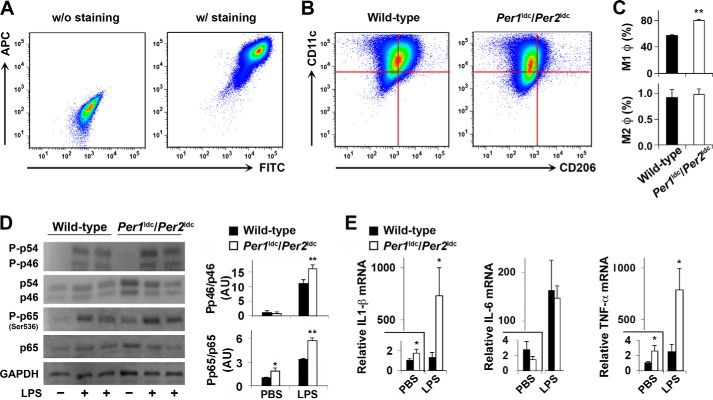
Per1/2 disruption increases macrophage proinflammatory activation. BMDM were prepared from chow diet-fed wild-type mice and Per1ldc/Per2ldc mice with targeted disruption of the clock genes Per1 and Per2 (n = 4–6). A, representative plots of macrophage purity and gating. BMDM were included without (left panel) or with (right panel) FITC-labeled anti-F4/80 and allophycocyanin (APC)-labeled anti-CD11b antibodies and examined for FITC and APC intensities. B and C, BMDM were examined for F4/80 and CD11b expression. Mature macrophages (F4/80+ CD11b+ cells) were then gated for CD11c and CD206 expression. Panels in B, representative plots of proinflammatory (M1) macrophages (F4/80+ CD11b+ CD11c+ CD206− cells) and anti-inflammatory (M2) macrophages (F4/80+ CD11b+ CD11c− CD206+ cells); bar graph in C, top panel for the percentages of M1 macrophages (upper left quadrant of panels in B) in mature macrophages and bottom panel for M2 macrophages (bottom right quadrant of panels in B). D, macrophage inflammatory signaling. Before harvest BMDM were treated with LPS (100 ng/ml) or PBS for 30 min. The levels of total and phosphorylated JNK1 (p46) and NF-κB p65 were examined using Western blot analyses and quantified using densitometry. E, macrophage mRNA levels of proinflammatory cytokines. Before harvest, BMDM were treated with LPS (100 ng/ml) or PBS for 6 h. The mRNA levels of IL-1β, IL-6, and TNFα were quantified using real-time PCR and plotted as relative expression. For bar graphs (C–E), data are the means ± S.E. *, p < 0.05; **, p < 0.01 Per1ldc/Per2ldc versus wild-type (C) under the same conditions (PBS or LPS) (D and E).

