FIGURE 7.
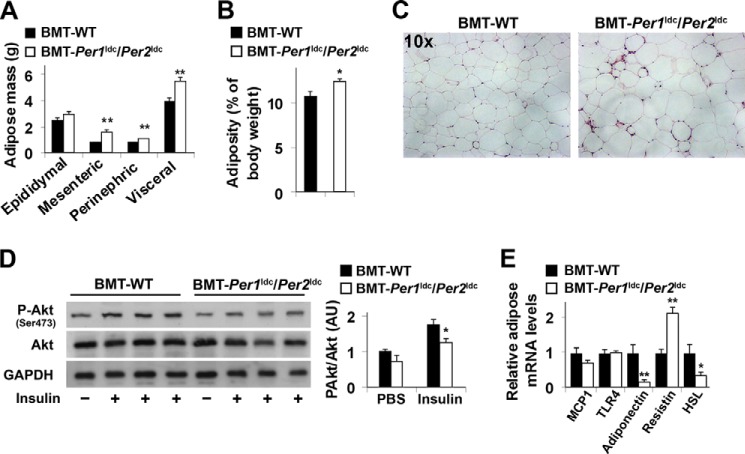
Myeloid cell-specific Per1/2 disruption exacerbates HFD-induced adiposity and adipose tissue insulin resistance. Chimeric mice (BMT-WT and BMT-Per1ldc/Per2ldc) were fed an HFD for 12 weeks (n = 6–10). Before tissue collection or insulin injection, mice were fasted for 4 h starting at the same time of the day. A, adipose mass. Abdominal fat mass was calculated as the sum of epididymal, mesenteric, and perinephric fat content. B, adiposity was calculated by normalizing abdominal fat content to body weight. C, H&E staining of adipose tissue. D, adipose tissue insulin signaling. After fasting, HFD-fed chimeric mice were given a bolus injection of insulin (1 unit/kg of body weight) or PBS into the portal vein. The levels of total and phosphorylated Akt1/2 were examined using Western blot analyses and quantified using densitometry. E, adipose tissue gene expression. The adipose mRNA levels of genes involved in adipose tissue inflammatory and metabolic responses were quantified using real-time PCR and plotted as relative expression. For bar graphs (A, B, D, and E), data are the means ± S.E. *, p < 0.05; **, p < 0.01 BMT-Per1ldc/Per2ldc versus BMT-WT (B) for the same fat pad (A) or under the same condition (insulin in D) or for the same gene (E). AU, arbitrary units.

