
FIGURE 3.
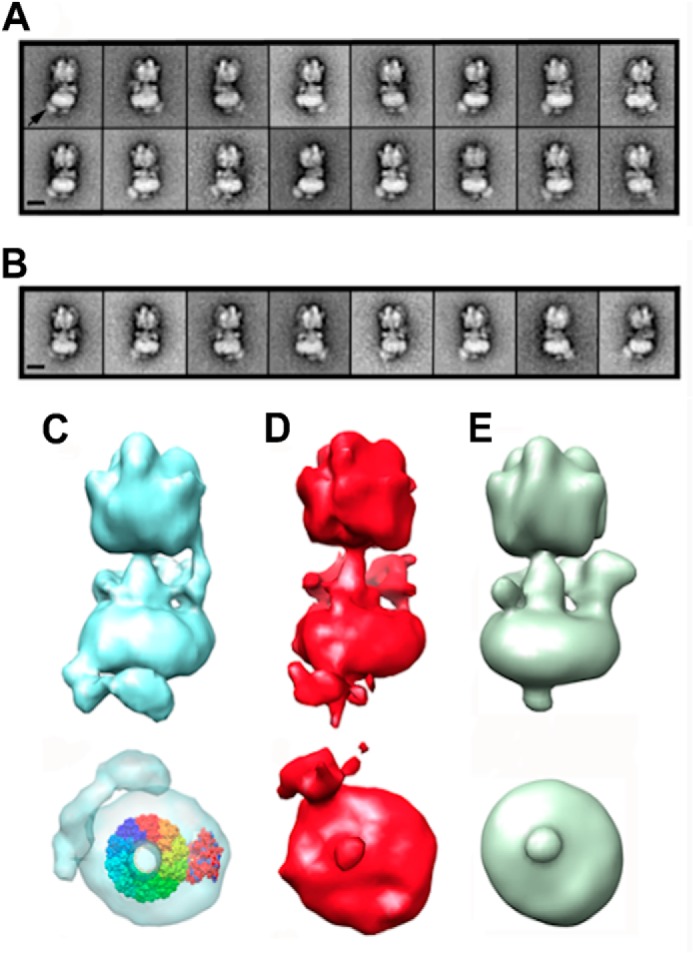
Electron microscopy of PA1b-bound V-ATPase. A, representative classes of PA1b-streptavidin-HRP-bound V-ATPase in the absence of ATP. B, as A but in the presence of 2 mm Mg·ATP. The PA1b-streptavidin-HRP density is indicated by an arrow in the far left panel 1 of A. Scale bars in both A and B represent 15 nm. C–E, three-dimensional reconstructions of the V-ATPase viewed perpendicular to the long axis of the complex (upper image) and from the extracellular end (lower image) bound to PA1b (C), bound to PA1b after the addition of Mg·ATP (D) and a control with no PA1b (E). All models were generated using EMAN, and the picture was produced using Chimera rendered at the same sigma level. In C (lower), the decameric c ring (Protein Data Bank ID code 2DB4 (53) rainbow colors) and a subunit model (red) have been fitted to the PA1b-streptavidin-HRP V-ATPase reconstruction in the absence of ATP using Chimera. If catalytically active, the c ring would rotate counterclockwise with respect to subunit a when observed from this perspective.