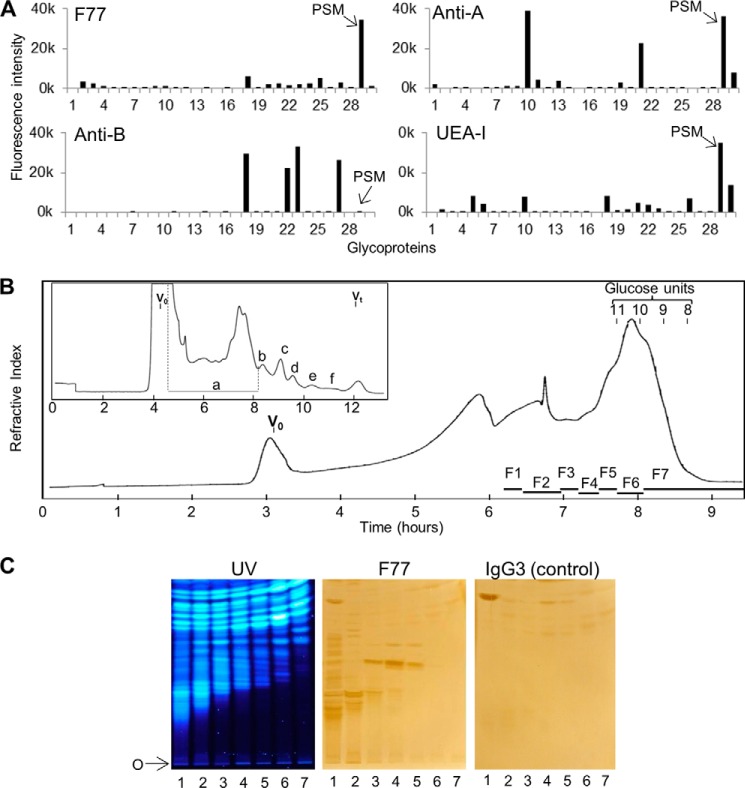
FIGURE 3.
Detection of F77 antigen on PSM and on minor components among O-glycans released from the mucin. A, microarray analyses of mAbs F77, anti-B (89-F), anti-A (T36), and UEA-I lectin with mucin-type glycoproteins. The descriptions of the glycoproteins are in Table 1. Results are the means of fluorescence intensities of duplicate spots printed at 150 pg of glycoprotein per spot. The error bars represent half of the difference between the two values. B, gel filtration chromatography of the products of reductive alkaline hydrolysis from PSM. Inset is the initial chromatography profile using a Bio-Gel P4 column (1.6 × 90 cm) eluted with H2O. The main panel shows the profile of fraction a from the Bio-Gel P4 column, chromatographed using a Bio-Gel P6 column (1.6 × 90 cm) eluted with H2O. V0 is the void volume of the column; Vt is the total volume; glucose units 8–11 indicate positions of elution of oligosaccharides with degrees of polymerization 8–11 in an acid hydrolysate of dextran. F1–F7 designate the pooled fractions that were converted to NGLs. C, binding of mAb F77 to NGLs derived from the O-glycans in fractions 1–7. The NGLs derived from the O-glycans in fractions 1–7 were chromatographed on silica gel HPTLC plates, using CHCl3/MeOH/H2O, 60:35:8 (v/v), as solvent. The fluorescent NGLs were visualized under UV light (left panel). The same plate and a duplicate plate were incubated with mAb F77 (middle panel) and the isotype IgG3 control, MG3-35 (right panel), followed by biotinylated anti-mouse immunoglobulins. Binding was detected as in Fig. 1. O indicates the origin.

