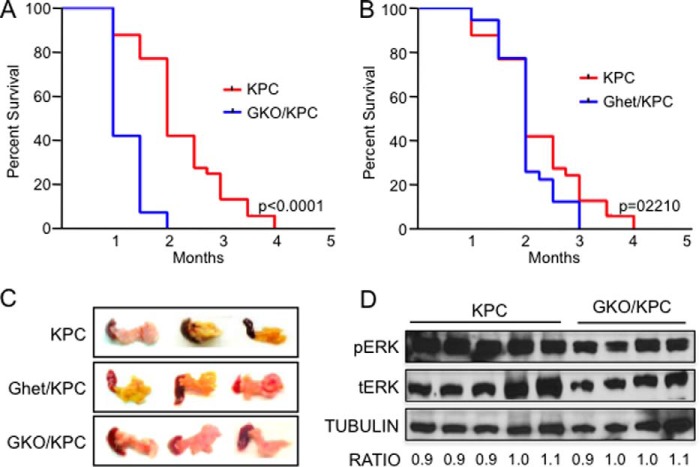
FIGURE 1.
GKO/KPC mice develop pancreatic cancer but have lower survival. A, Kaplan-Meir survival curve shows a statistically significant difference in survival between the GKO/KPC (1 month) compared with 2.5 months in KC mice. B, no differences in survival were detected in GHet/KPC mice compared with the KPC animals. C, representative pancreatic tumors of KPC, GHet/KPC, and GKO/KPC on autopsy/death. D, representative Western blot demonstrating activation of the KRAS downstream effector ERK by looking at the levels of phosphoylated-ERK (pERK) in KPC and GKO/KPC. Densitometry of total ERK (tERK), pERK, and tubulin was used to quantify levels of the proteins in both cohorts.

