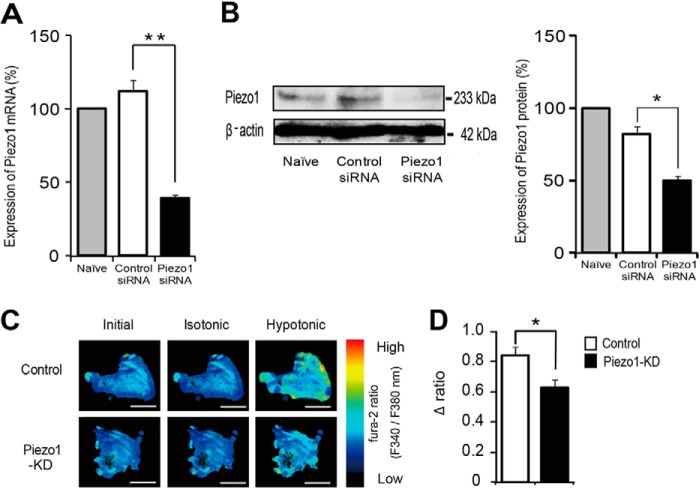
FIGURE 2.
Effects of siRNA-mediated knockdown of Piezo1 on primary urothelial cultured cells. A, quantitative analysis of Piezo1 mRNA levels by real-time RT-PCR in control mouse primary-cultured urothelial cells (Naïve) and cells treated with control siRNA or Piezo1 siRNA. Data are presented as percentage of naive cells (n = 6). B, detection of Piezo1 protein by immunoblotting in lysates from mouse primary-cultured urothelial cells. Representative gel images (left) and analyzed data (right) are shown (Piezo1, 233 kDa; β-actin, 42 kDa). Data are presented as percentage of naive cells (n = 3). C, changes in [Ca2+]i from control siRNA-treated urothelial cells and Piezo1-KD urothelial cells upon exposure from isotonic (340 mosm) to hypotonic (200 mosm) solution, as indicated by the fura-2 ratio with pseudocolor expression. Scale bars, 100 μm. D, average changes in [Ca2+]i (difference between base and peak (Δ ratio)) by hypotonic stimulation (n = 12 experiments (233 cells) for control and 13 experiments (254 cells) for Piezo1-KD). All data are presented as means ± S.E. (error bars). *, p < 0.05; **, p < 0.01, Student's t test, as compared with the control.

