
FIGURE 4.
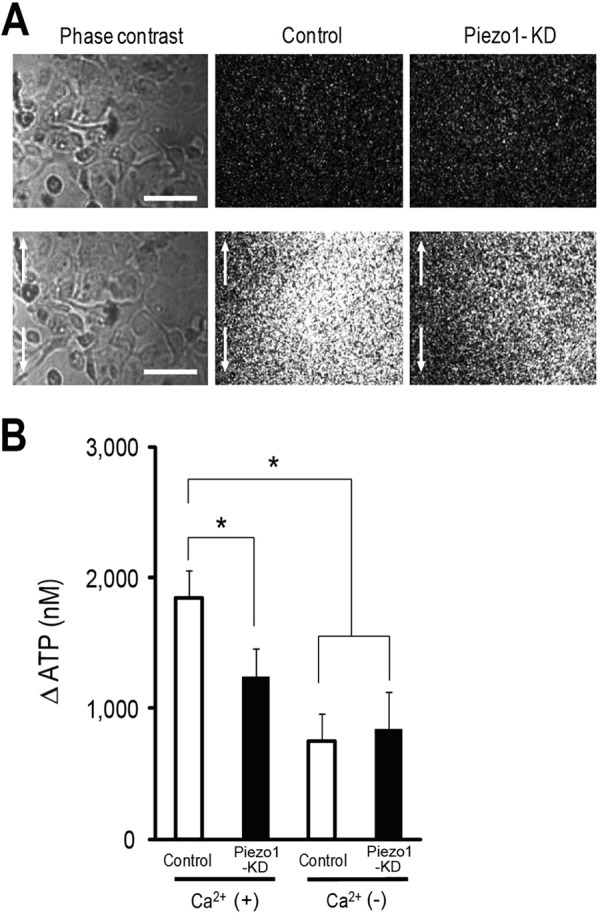
Visualization of stretch-induced ATP release from urothelial cells. A, left panels show urothelial cells in phase-contrast images, and the middle and right panels show photon count images of control cells (Control) and Piezo1-KD cells, respectively. The top and bottom panels show the images before and after mechanical stretch, respectively. Stretch speed was 100 μm/s, and stretch distance was 200 μm. Cells were extended to the vertical axis (indicated by arrows). Scale bars, 100 μm. B, average amount of ATP released from control siRNA-treated urothelial cells (Control) and Piezo1-KD cells in the presence (+) or absence (−) of extracellular Ca2+. Data are from eight experiments for each group. Data are presented as means ± S.E. (error bars). *, p < 0.01, Tukey-Kramer method.