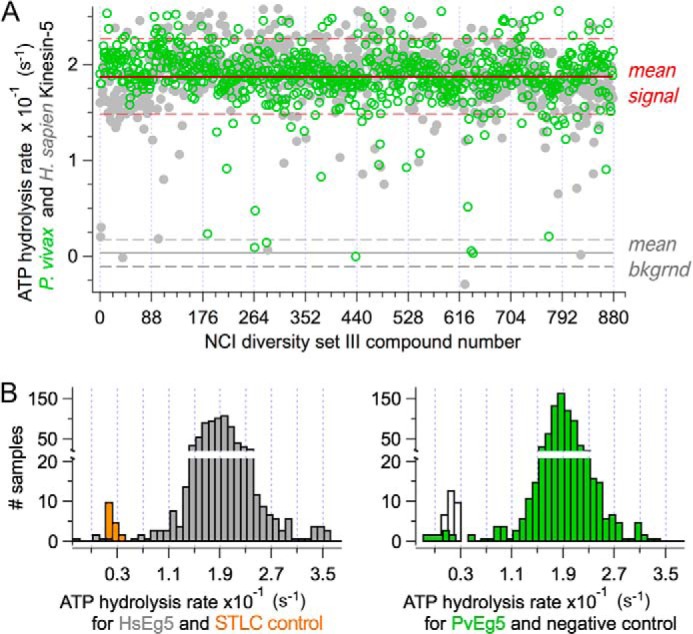
FIGURE 3.

Scatter plot for a replicate set for the small molecule screen. A, scatter plot of basal ATPase activity for PvEg5 (green circles) and HsEg5 (gray circles) challenged by the first 800 compounds (100 μm) from the NCI Diversity Set III. Red line, overall mean enzyme ATPase rate. Dashed red lines, 3 σ distance away from mean. Gray line, background (without motor) signal. Dashed gray lines, 3 σ distance away from mean to mark background levels. B, histograms of the frequency of ATPase rates from scatter plot above showing the distributions of mean HsEg5 ATPase rates (right) and PvEg5 ATPase rates (left) and the mean rates of separation from background levels, respectively.
