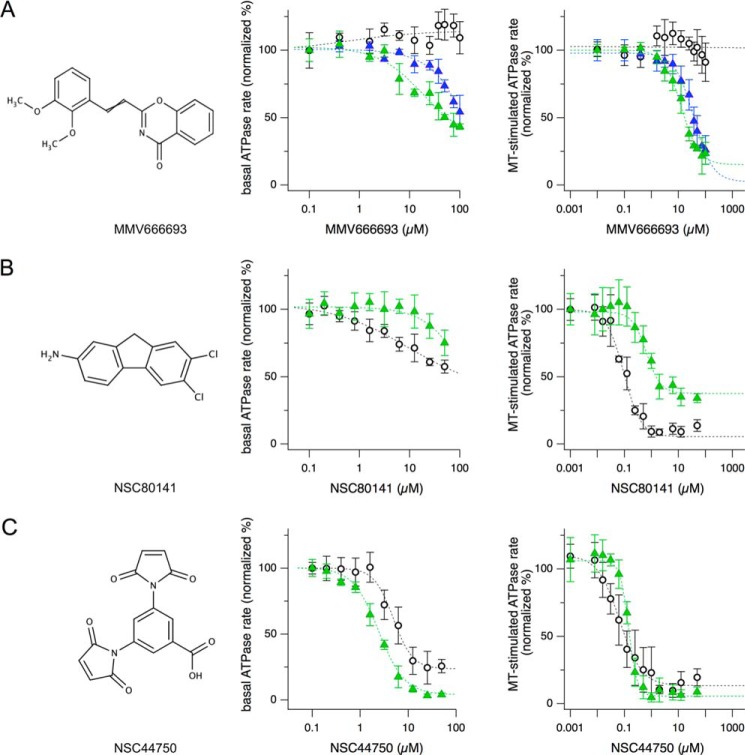
FIGURE 4.
Examples of dose-response curves from the three classes of hit compounds. Shown are chemical structures (left panels) and dose-response curves of both the basal (middle panels) and MT-stimulated (right panels) ATPase assays for Plasmodium-specific inhibitor MMV666693 effects on PvEg5 (green triangles, IC50 = 12.5 μm), PfEg5-ΔL6 (blue triangles, IC50 = 23.4 μm), and HsEg5 (open circles) (A), HsEg5-selective inhibitor NSC80141 effects on PvEg5 (green triangles, IC50 = 769 nm) and HsEg5 (open circles, IC50 = 99 nm) (B), and non-selective inhibitor NSC44750 effects on PvEg5 (green triangles, IC50 = 75 nm) and HsEg5 (open circle, IC50 = 176 nm) (C). Error bars, S.D.

