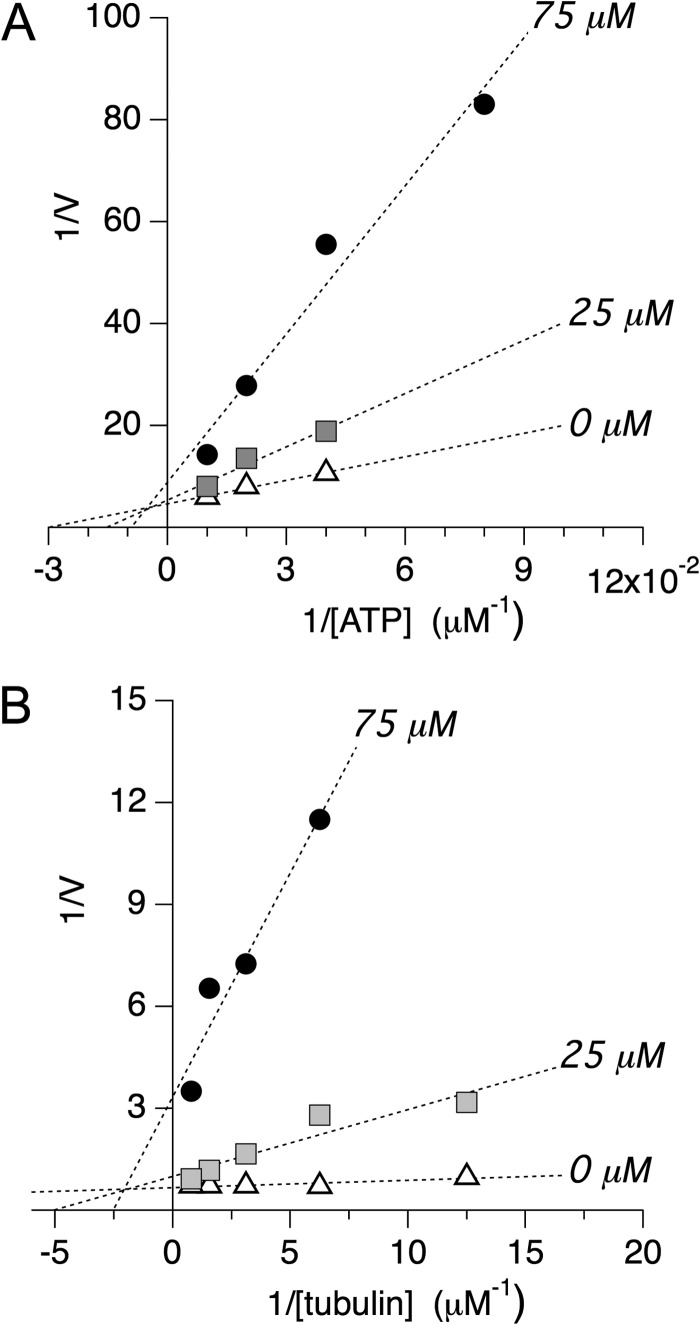
FIGURE 5.
Double-reciprocal plot analysis of selective inhibitor MMV666693. A, double-reciprocal plot analysis of PvEg5 to determine the mode of inhibition with respect to ATP. We find that both Km and Vmax vary at different inhibitor concentrations, supporting an allosteric mixed mode model of inhibition. Km values are 33 ± 5, 66 ± 26, and 110 ± 75 for 0, 25, and 75 μm inhibitor, respectively. Vmax values are 0.22 ± 0.02, 0.19 ± 0.07, and 0.11 ± 0.08 for 0, 25, and 75 μm inhibitor, respectively. B, double-reciprocal plot analysis of PvEg5 to determine the mode of inhibition with respect to microtubules. Similar to the results with ATP, we find that both Km and Vmax vary at different inhibitor concentrations, again supporting an allosteric mixed mode model of inhibition. Km values are 0.03 ± 0.01, 0.20 ± 0.07, and 0.40 ± 0.13 for 0, 25, and 75 μm inhibitor, respectively. Vmax values are 1.5 ± 0.1, 1.0 ± 0.3, and 0.3 ± 0.1 for 0, 25, and 75 μm inhibitor, respectively.

