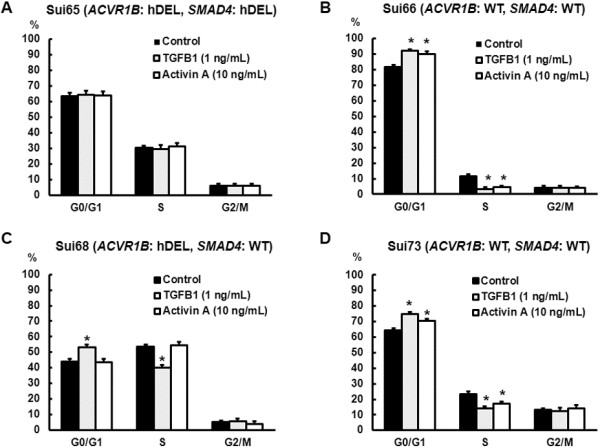
Figure 4.

Influence of TGFB1 and activin A on the cell cycle. The cell lines were exposed to the ligands (TGFB1, 1 ng/mL; activin A, 10 ng/mL) for 48 hours. The cells were then stained using propidium iodide/RNase Staining Buffer and were analyzed using a flow cytometer. (A) Cell cycle distribution of Sui65 cell line (homozygous deletion of ACVR1B and SMAD4 genes). Both TGFB1 and activin A did not influence the cell cycle distribution. (B) Cell cycle distribution of Sui66 cell line (wild-type ACVR1B and SMAD4 genes). Both TGFB1 and activin A increased the proportion of cells in G0/G1 phase (P = 0.0039* and 0.031*, respectively) and decreased the proportion of cells in S phase (P = 0.0043* and 0.039*, respectively). (C) Cell cycle distribution of Sui68 cell line (homozygous deletion of the ACVR1B gene and wild-type SMAD4 gene). TGFB1 increased the proportion of cells in G0/G1 phase (P = 0.0016*) and decreased the proportion of cells in S phase (P = 0.019*), while activin A did not influence the cell cycle distribution. (D) Cell cycle distribution of Sui73 cell line (wild-type ACVR1B and SMAD4 genes). As is seen in the Sui66 cell line, both TGFB1 and activin A increased the proportion of cells in G0/G1 phase (P = 0.014* and 0.039*, respectively) and decreased the proportion of cells in S phase (P = 0.0034* and 0.0021*, respectively). hDEL, homozygous deletion; WT, wild-type; Columns, mean of independent triplicate experiments; Bars, SD; *P < 0.05.
