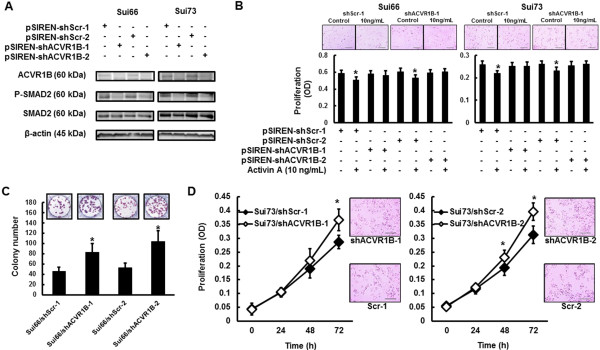
Figure 6.

Role of ACVR1B gene in colony formation and cellular growth. To evaluate the role of the ACVR1B gene, we used stable ACVR1B-knockdown cell lines (shACVR1B) or control (shScr). (A) Western blot analyses after activin A stimulation (10 ng/mL). In contrast to Sui66/shScr and Sui73/shScr cell lines, ACVR1B was not expressed in Sui66/shACVR1B and Sui73/shACVR1B cell lines. SMAD2 was not phosphorylated by activin A in Sui66/shACVR1B and Sui73/shACVR1B cell lines. β-actin was used as an internal control. (B) Influence of activin A on cellular growth. The cell lines were stimulated with or without activin A (10 ng/mL) for 72 hours. Cell proliferation was assayed using an MTT assay. Although activin A inhibited cellular growth in Sui66/shScr and Sui73/shScr cell lines (Sui66/shScr-1; P = 0.0014*, Sui66/shScr-2; P = 0.0032*, Sui73/shScr-1; P = 0.0085*, and Sui73/shScr-2, P = 0.0053*, respectively), it did not influence the cellular growth in Sui66/shACVR1B and Sui73/shACVR1B cell lines (Sui66/shACVR1B-1; P = 0.81, Sui66/shACVR1B-2; P = 0.73, Sui73/shACVR1B-1; P = 0.90, and Sui73/shACVR1B-2; P = 0.87, respectively). (C) Colony formation of Sui66-transfectant cell lines. The colony formations in Sui66/shACVR1B cell lines were enhanced, compared with that in the control cell lines (Scr-1, 46.11 ± 8.00 vs. ACVR1B-1, 83.00 ± 16.75, P = 0.026* and Scr-2, 52.55 ± 9.24 vs. ACVR1B-2, 103.70 ± 21.00, P = 0.017*). (D) Cellular growth of Sui73-transfectant cell lines. The cellular growth was evaluated using an MTT assay. The cellular growths in Sui73/shACVR1B cell lines were enhanced, compared with Sui73/shScr (shScr-1 vs. shACVR1B-1, 0 h, P = 081; 24 h, P = 0.88; 48 h, P = 0.063; 72 h, P = 0.013*, and shScr-2 vs. shACVR1B-2, 0 h, P = 040; 24 h, P = 0.45; 48 h, P = 0.040*; 72 h, P = 0.014*). Columns, mean of independent triplicate experiments; Lines, mean of independent triplicate experiments; Bars, SD; *P < 0.05.
