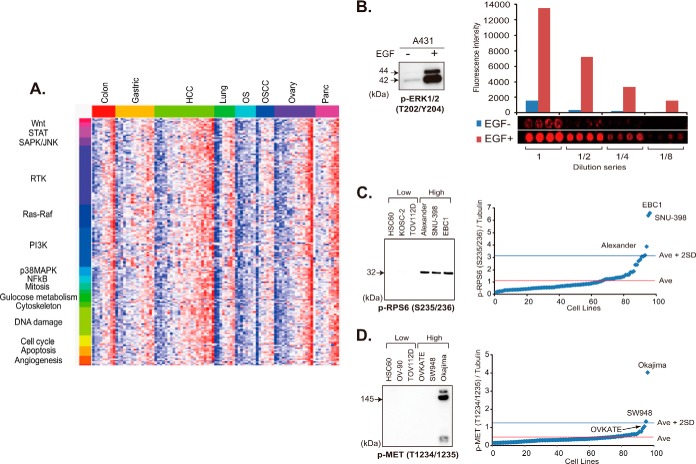
Fig. 1.
Phosphoprofiling of key signaling molecules by RPPA. A, phosphorylation status of 180 signaling nodes in a panel of 95 cancer cell lines cultured in the presence of 10% FCS. Red and blue colors indicate high- and low-level phosphorylation, respectively. STAT, signal transducers and activators of transcription; SAPK/JNK, stress-activated protein kinase/c-Jun NH2-terminal kinase; RTK, receptor tyrosine kinase; PI3K, phosphatidylinositol 3′-kinase; MAPK, mitogen-activated protein kinase; NFκB, nuclear factor-kappaB; OS, osteosarcoma; OSCC, oral squamous cell carcinoma. B, immunoblot (left) and RPPA (right) analyses of A431 cells cultured without (−) and with (+) EGF for 10 min with anti-p-ERK1/2 (T202/Y204) antibody. The mean fluorescence intensity in arbitrary units (top) and images (bottom) of quadruplicate RPPA spots of lysate undiluted (1) and diluted 1:2 (1/2), 1:4 (1/4), and 1:8 (1/8) -fold are shown (right). C, D, relative p-RPS6 S235/236 (C) and p-Met T1234/1235 (D) expression of 95 cell lines determined via RPPA (right). Cell lines with the three highest and three lowest levels of expression were selected and subjected to immunoblotting with the same antibody (left). Ave, average.

