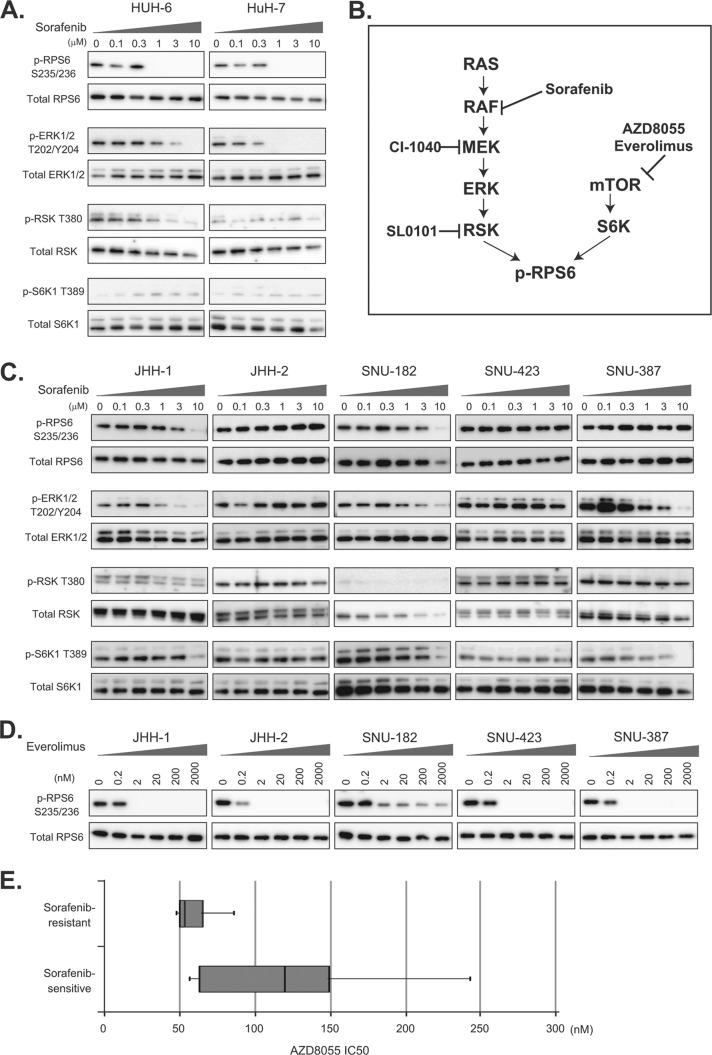
Fig. 3.
Alternative mTOR signal activation in sorafenib-resistant HCC cells. A, C, representative sorafenib-sensitive (HUH-6 and HuH-7) and -resistant (JHH-1, JHH-2, SNU-182, SNU423, and SNU-387) HCC cells were treated with the indicated concentrations of sorafenib for 3 h, and the expression of p-RPS6 S235/236, total RPS6, p-ERK1/2 T202/Y204, total ERK, p-RSK T380, total RSK, p-S6K T389, and total S6K was determined via immunoblotting. B, schematic representation of the mTOR and MAPK pathways and their inhibitors. D, representative sorafenib-resistant (JHH-1, JHH-2, SNU-182, SNU423, and SNU-387) HCC cells were treated with the indicated concentrations of everolimus for 3 h, and the expression of p-RPS6 S235/236 and total RPS6 was determined via immunoblotting. E, distribution of IC50 values of representative sorafenib-sensitive (SNU-449, HUH-6, JHH-7, HuH-7, and SK-Hep1) and -resistant (JHH-1, JHH-2, SNU-182, SNU-423, and SNU-387) HCC cells to AZ8055. Boxes indicate 25th to 75th percentiles.

