
Fig. 3.
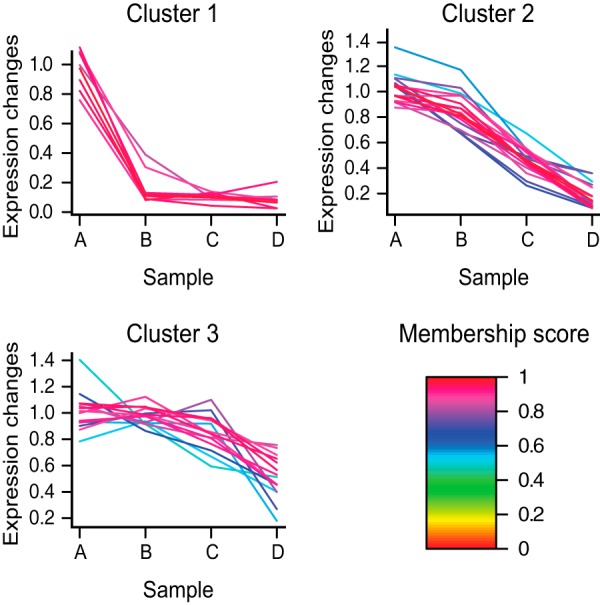
Unsupervised clustering analysis for the putative E-3810 targets selected through the competition assay. Proteins were grouped according to the trends of ratio modulation from sample A to sample D upon E-3810 competition. Cluster 1 contained proteins competed with the lowest concentration of E-3810, suggesting the highest affinity for the free form of the drug. Cluster 2 contained proteins competed at a medium concentration of E-3810, representing medium-affinity targets. Cluster 3 contained proteins competed only by the highest doses of free E-3810. Color-coded membership values, indicating the goodness of fit to the three clusters, are indicated in the legend. The members of each cluster are listed in supplemental Table S2.