
Fig. 4.
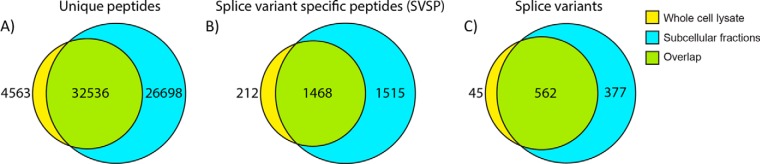
Identified splice-variant-specific peptides in the A431 cell line dataset. Venn diagram comparing the output of whole cell lysate analysis with the analysis of the combined subcellular fractions. From left to right are illustrated the number of (A) unique peptides, (B) splice-variant-specific peptides, and (C) splice variants.