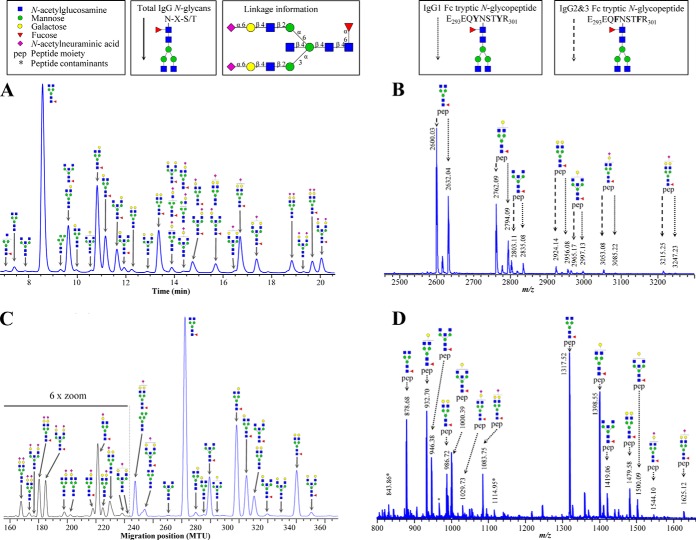
Fig. 1.
Representative data from IgG glycosylation analysis of the same individual by (A) UPLC-FLR (continuous lines - total IgG N-glycans), (B) MALDI-TOF-MS (dotted lines - tryptic IgG1 Fc N-glycopeptide [M-H]− ions, striated lines - IgG2&3 Fc N-glycopeptide [M-H]− ions), (C) xCGE-LIF (continuous lines - total IgG N-glycans), and (D) LC-ESI-MS (dotted lines - tryptic IgG1 Fc N-glycopeptide [M+2H]2+ and [M+3H]3+ ions). Structural schemes are given in terms of pep (peptide moiety), blue square (N-acetylglucosamine), red triangle (fucose), green circle (mannose), yellow circle (galactose), and purple diamond (N-acetylneuraminic acid). Linkage information is given to indicate separation of linkage isomers by UPLC-FLR and xCGE-LIF. Glycan structures are assigned to most of the signals. The complete list of the assigned IgG N-glycans (UPLC-FLR and xCGE-LIF) and IgG N-glycopeptides (MALDI-TOF-MS and LC-ESI-MS) with the charge states corresponding m/z values is given in supplementary Table S1.

