
Fig. 5.
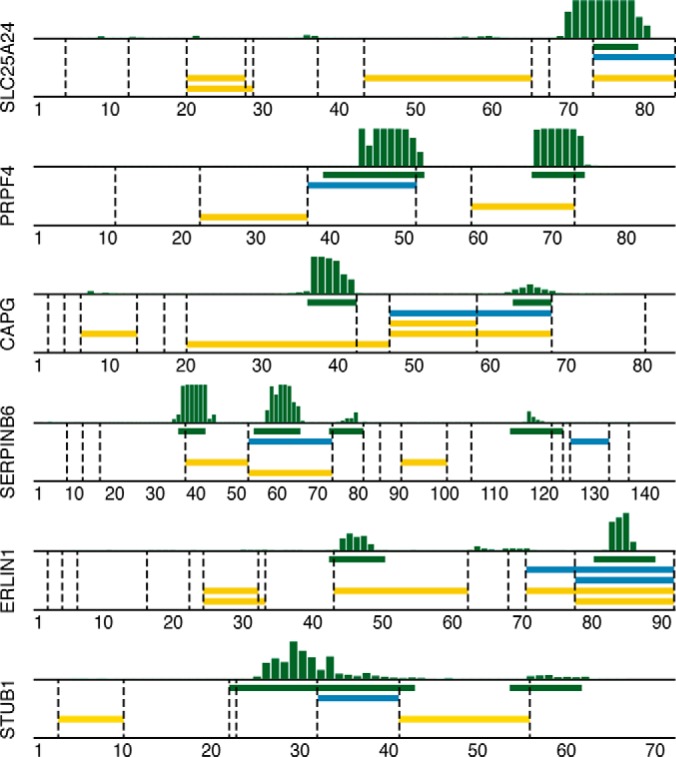
Comparison of epitope mapping, immuno-SILAC, and PrEST-SILAC peptides. Horizontal bars show the locations of linear epitopes (green) and peptides identified in immuno-SILAC (blue) and PrEST-SILAC (yellow) on their corresponding antigen; dashed vertical lines indicate trypsin cleavage sites. Above each plot, the raw epitope mapping binding intensities to overlapping 12-mer peptides are shown as vertical bars.