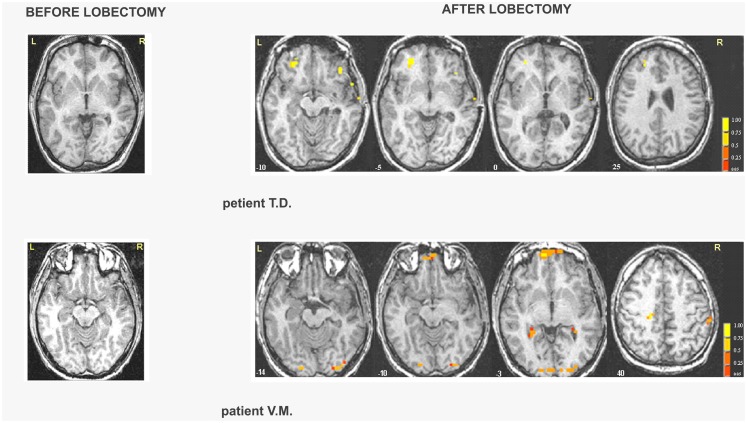
Figure 3.
Areas of significant activation in response to fearful expressions in right MTLE patients before and after lobectomy. The numbers at the bottom of each sagittal slice represent z-axis levels according to Talairach coordinates. The statistical threshold is set at p < 0.001 (uncorrected) with a spatial extension of at least four contiguous voxels.

