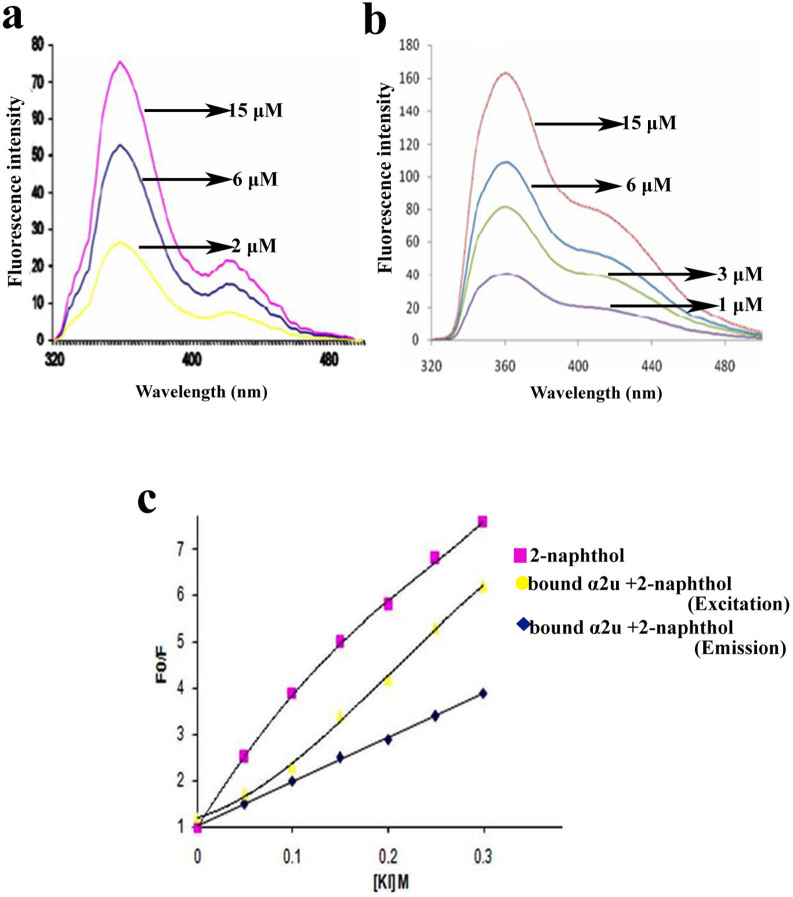
Figure 4. Fluorescence titrations study.
(a) The inverse titration experiments showed spectra of 25 μM 2-naphthol at different α2u concentrations shows 2 μM (yellow line), 6 μM (blue line), and 15 μM (pink line). (b) The direct titration experiments show spectra of 24 μM α2u at different 2-naphthol increasing concentrations (1 μM, 3 μM, 6 μM and 15 μM). (c) Stern-Volmer plots of 2-naphthol with potassium iodide (KI) fluorescence quenching experiments.

