
Figure 3.
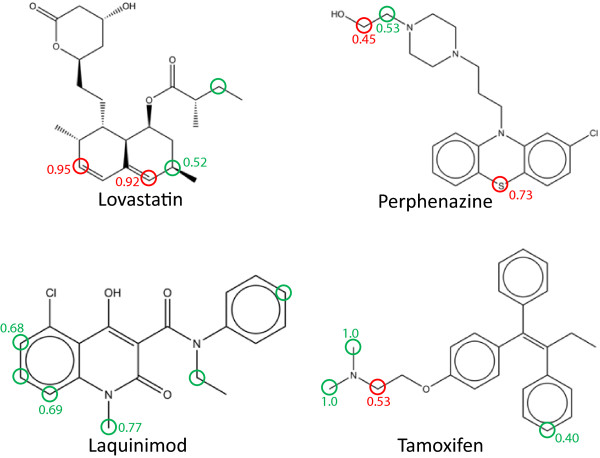
Example SoM predictions. Graphic to summarise the classification results for four molecules chosen at random from the CYP 3A4 data set using the scenario with a bond depth of 4, q=45, j=201 and the RASCAL classifier. SoMs have been labelled with a green circle and the scores for the top three predictions are labelled against the atom: green text is used where a SoM is identified, red text is used with a corresponding red ring where a non-SoM is identified.