
Figure 4.
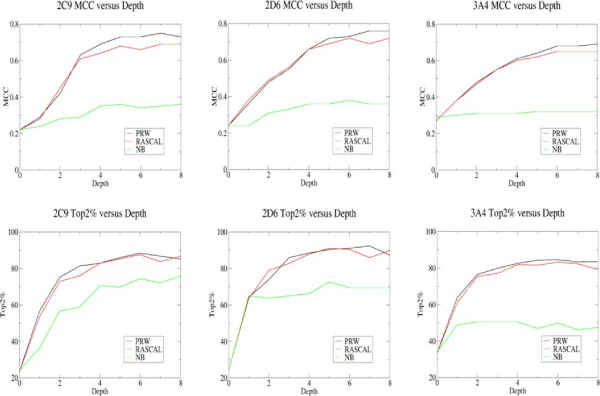
Prediction performance in terms of MCC and top-2%. Graphs showing classification performance in terms of MCC and top-2% (the percentage of the data sets where a SoM is identified in the top 2 atom positions) for the three data sets against the circular fingerprint bond depth used to build the models. The number of iterations j=201.