
Figure 5.
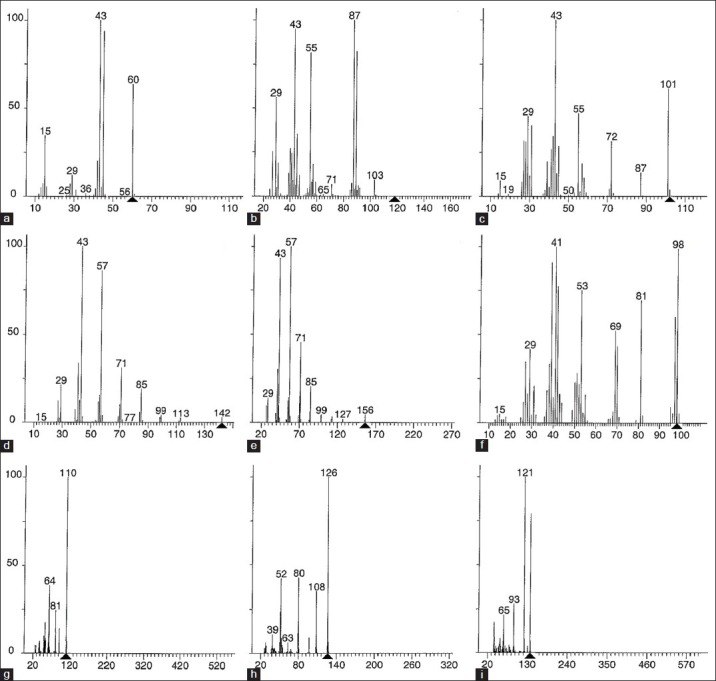
Mass spectra of P. triloculore ethyl acetate fruit extract peaks from GC separation. The spectra correspond to peaks from the GC chromatogram with retention times of (a) 1.14 min, (b) 1.57 min, (c) 2.17 min, (d) 3.22 min, (e) 3.88 min, (f) 3.97 min, (g) 4.43 min, (h) 5.43 min, (i) 6.11 min