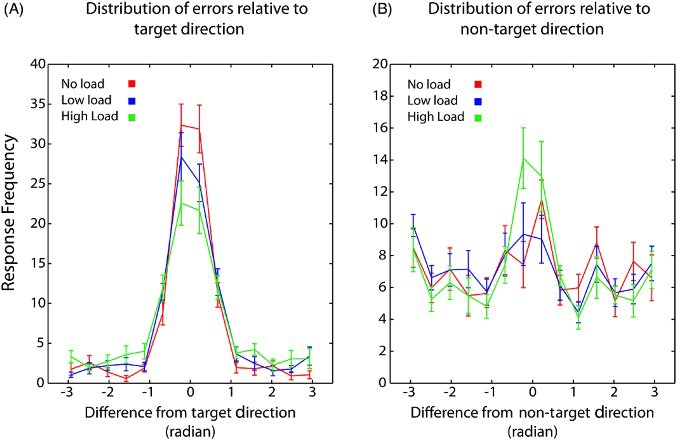
Figure 3.

Distribution of errors relative to target and non-target motion direction, Experiment 1. (A) Frequency of response as a function of the difference between the response and the target motion direction. Under high load condition, the variability in recall of the target direction (width of the distribution) increase and the peak of the distribution centred around target value (zero) decreases. (B) Frequency of response as a function of the difference between the response and the non-target motion direction. There is a larger proportion of responses around the non-target direction under high load condition compared to the other two conditions. Error bars indicate SEM (N = 12).
