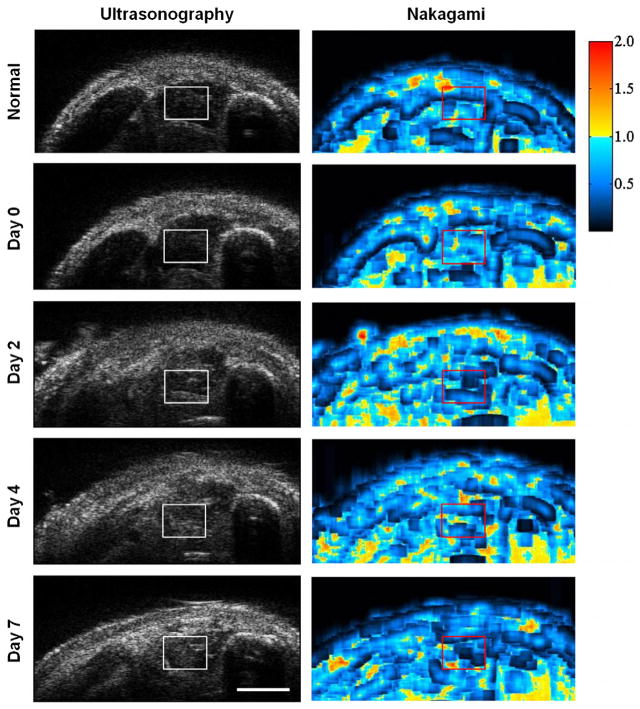
Fig. 2.
Complete fractures were created on the middle shaft of tibia in mice. 48 MHz ultrasound images were obtained in the same mice before fracture, immediately after the fracture injury (post-fracture day 0), and on post-fracture days 2, 4, and 7 (left panel). The distributions of scattering properties for the tissue after fracture were demonstrated by Nakagami distribution (right panel). The region of interest was labeled in square with the prefer size of 80 × 60 pixels. Bar = 1 mm.

