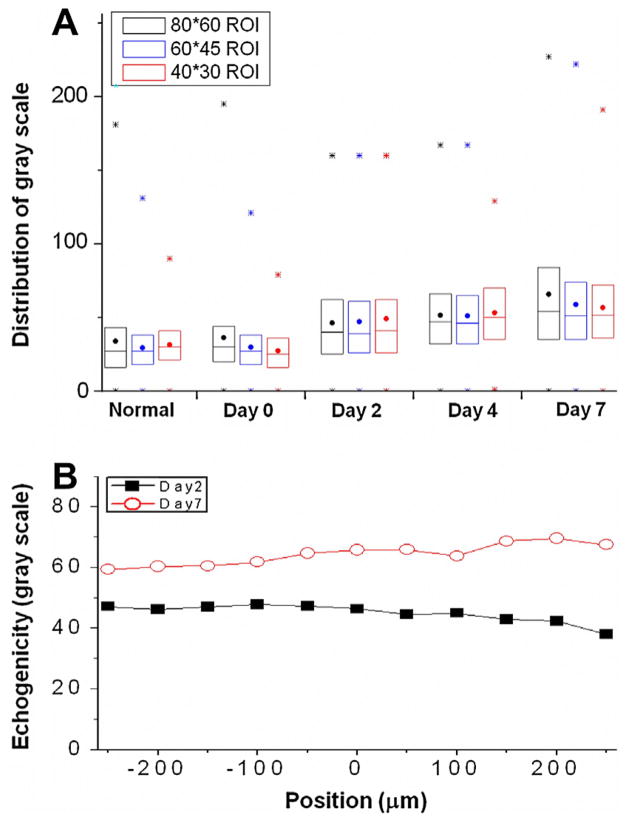
Fig. 3.
The distributions for the gray-scale in the region of interest (ROI) were demonstrated by the max/min (*), the range of 75–50–25% (box), and mean value (.) (A). The increases of gray scale in major population were observed regardless of ROI sizes after fracture. To further confirm the distribution of tissue properties in three dimension, the echogenicity in different cross-sections distal (negative scale) and proximal (positive scale) to the selected plane (position = 0) used in current study were qualified by using the same reference position of ROI (B). As comparing to the difference of echogenicity observed between post-fracture day 2 and 7, the small changes of echogenicity within the range of 500 μm suggested the homogenous tissue properties within the inflammatory area.

