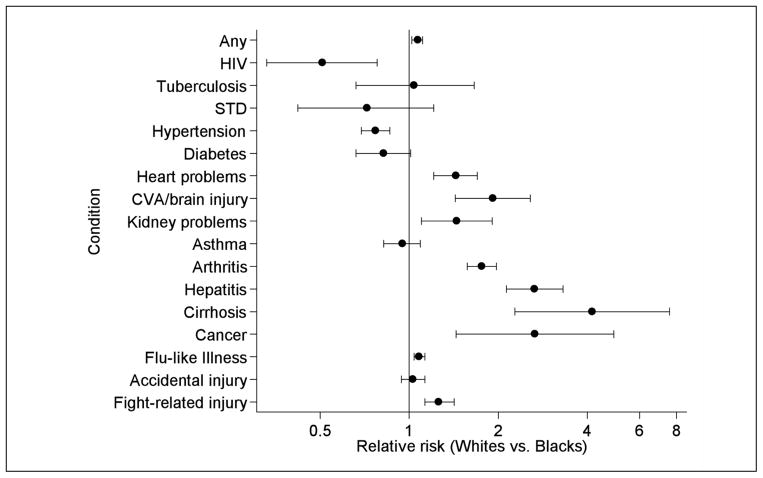
Figure 1.
Age-adjusted associations between race and selected health conditions among a nationally representative sample of male state prisoners in 2004. Blacks are the referent. Black circles represent point estimates; bars and caps represent 95% CIs. Estimates are plotted on the x-axis using log scaling. “Any” does not include flu-like illness.
HIV = Human Immunodeficiency Virus
STD = Sexually Transmitted Disease
CVA = Cerebral Vascular Accident
CIs = Confidence Intervals

