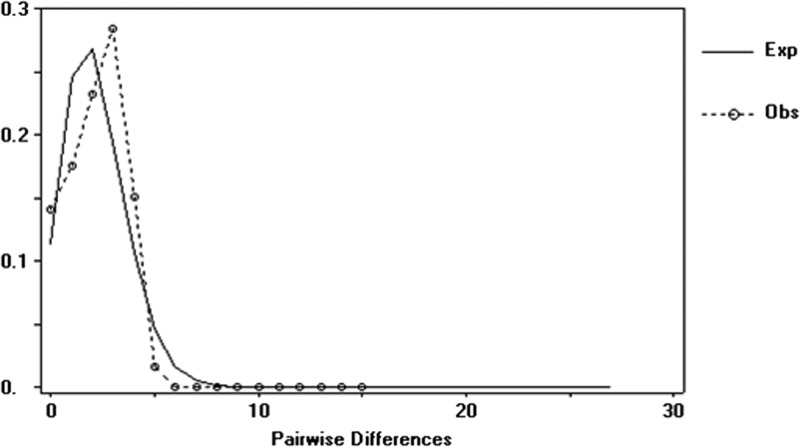
Figure 3.
Mismatch distribution of the 59 partial 12S ribosomal RNA sequences (357 basepairs) of six Oncomelania quadrasi populations from the Philippines. The mismatch distribution is the distribution of the number of pairwise differences among sequences. The expected distribution under a model of expansion is given as a continuous line, and the observed distribution is given as a dashed line. Exp = expected; Obs = observed.

