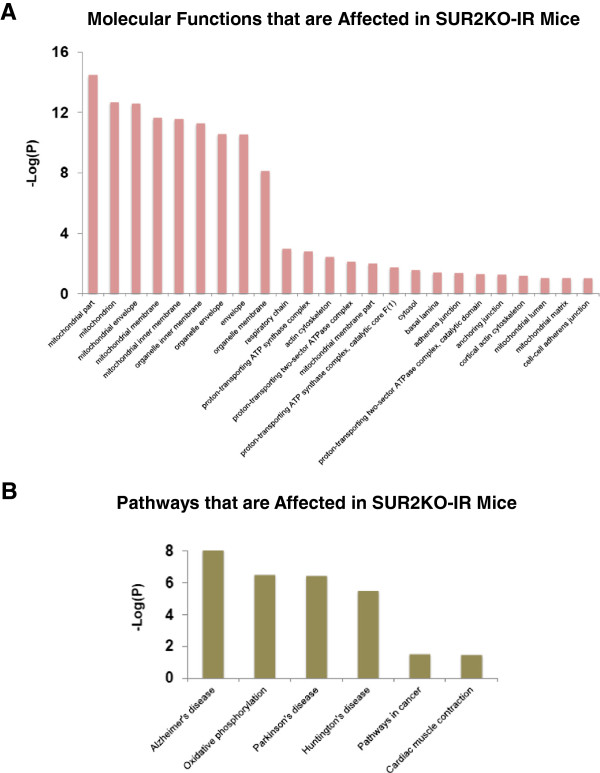
Figure 7.

Gene ontology and KEGG pathway enrichment analyses using the 41 identified protein hits shown in Table 1. (A) Enriched molecular function. (B) The 6 dysfunctional pathways identified in SUR2KO-IR mice. In A-B, P-values were used to report whether significance of overlaps with known functional categories was found. They were transformed into -Log values as shown on Y axis. Additional information is provided in Additional file 2.
