
Figure 4.
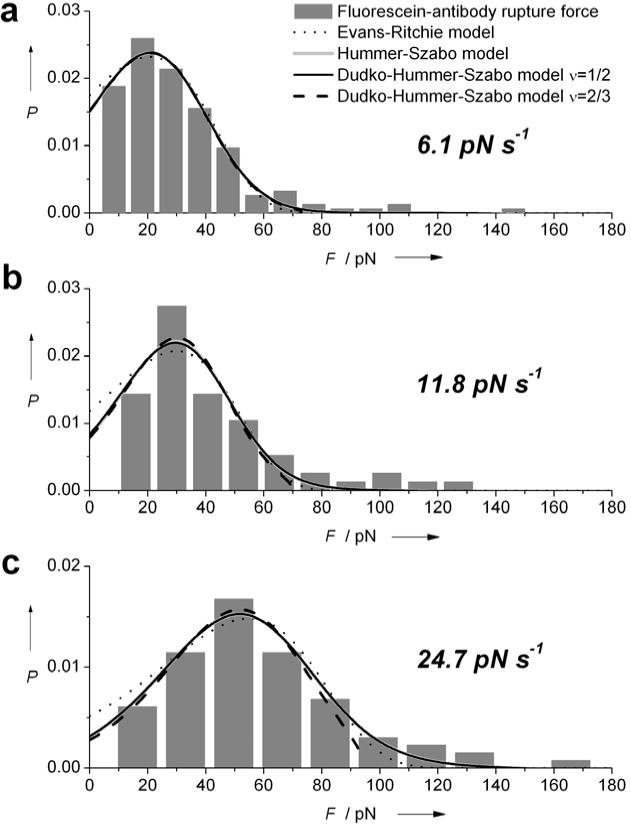
Rupture-force probability distributions for fluorescein binding to antibody 4-4-20 at average loading rates of a) 6.1 pN·s−1, b) 11.8 pN·s−1 and c) 24.7 pN·s−1. Histograms are fit to the model of Evans-Ritchie21 (dotted line), Hummer-Szabo22 (gray) and Dudko et al.23 assuming a cusp shaped (ν=1/2, black solid line) or a linear-cubic (ν=2/3, black dashed line) energy barrier.