
Figure 6.
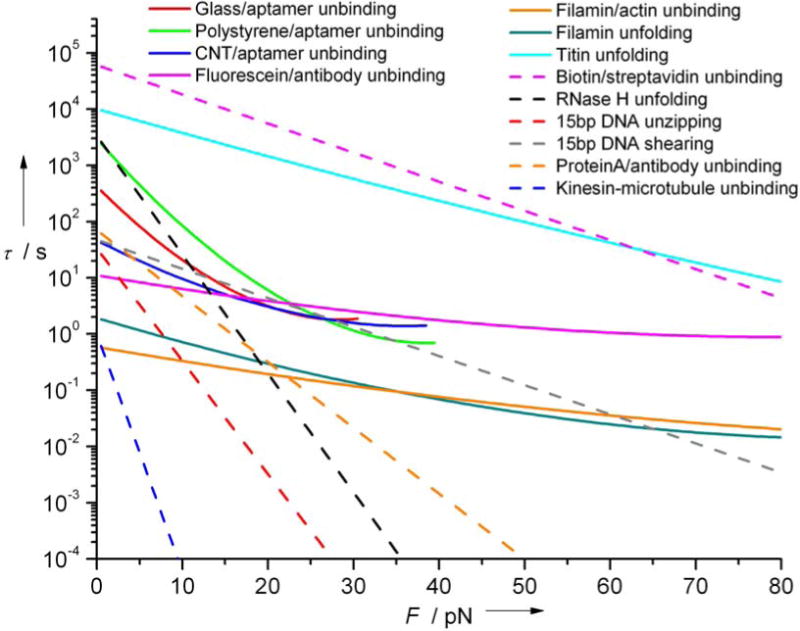
Lifetime τ(F) as a function of the applied force (F) compared to curves derived from parameters obtained from literature (Table 4) for a range of biological interactions. Kinesin-microtubule interaction is for single headed kinesin in ADP state with plus-end loading. τ(F) is obtained assuming a cusp-like barrier23 when ΔG‡ available solid lines; otherwise, Evans-Ritchie model21 is used with ν=1, dashed lines.