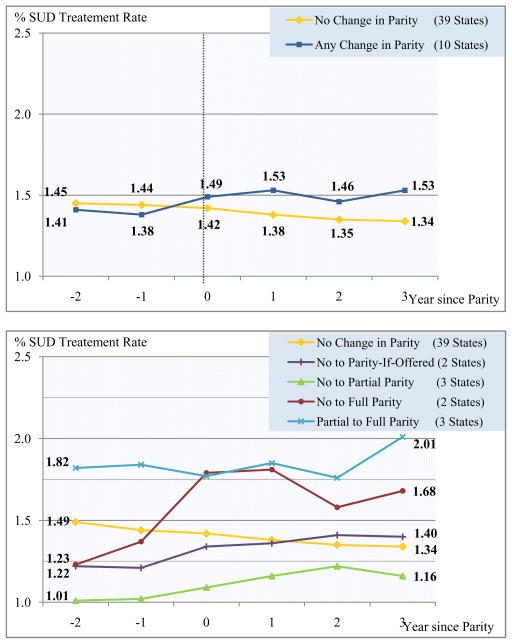
Figure 1.
Trend in substance use disorder (SUD) treatment rate by SUD parity status.
Note: Figure 1 presents state-aggregate SUD treatment rate during the pre- and post-parity period. We centered the year each parity state started to implement the law at Time 0. The vertical line represents the year during which each parity state started to implement or extend the law, and it corresponds to the period covered in: N-SSATS 2002 (April, 2001 to March, 2002) for DE and MI, N-SSATS 2003 (April, 2002 to March, 2003) for MT and RI, N-SSATS 2004 (April, 2003 to March, 2004) for ME and NH, N-SSATS 2005 (April, 2004 to March, 2005) for WI and WV, and N-SSATS 2007 (April, 2006 to March, 2007) 2007 for OR. Note that KY implemented parity during the gap year between N-SSATS 2000 and N-SSATS 2002, so Time 0 consisted of nine data points instead of ten. For the other “no change in parity” states, the treatment rates during 2002, 2003, 2004, 2005 and 2007 were weighted by 2/9, 2/9, 2/9, 2/9, and 1/9 to match the proportions of the states that implemented parity in a given year. Following the same procedure we determined Time −2, −1, 1, 2, and 3 for parity states, and then transferred “no change in parity” states to the corresponding time in accord with the parity states. Note that only 7 parity states were included for Time −1 (No data for KY, DE and MI), time 2 (No data for OR), and time 3 (No data for OR).

