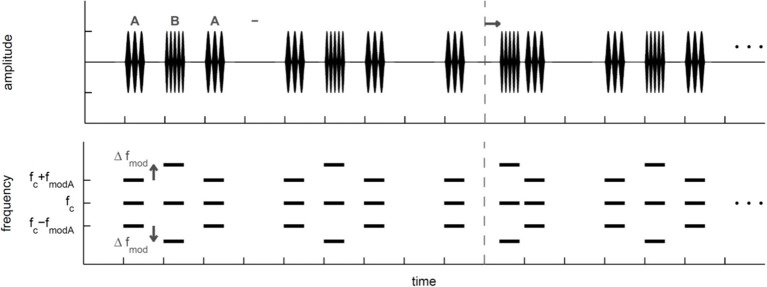
Figure 1.

Schematic view of the ABA-triplets presented in the objective task that relied on the detection of a time shifted B signal. In the third ABA- triplet a black arrow indicates the shift of the B signal, whereas the dashed line indicates the former position the un-shifted B signal. Top: Schematic temporal view of the ABA- triplets that were sinusoidally amplitude modulated (SAM) tones. A and B SAM tones had the same carrier frequency (fc) but different modulation frequencies (fmod). The fmod of the B SAM tone was always larger than the fmod of the A SAM tone (fmod A). Here the fmod difference between A and B SAM tones (Δfmod) is schematically shown (see Table 1 for exact values). Bottom: Schematic spectral view of the SAM ABA- triplets.
