Figure 3.

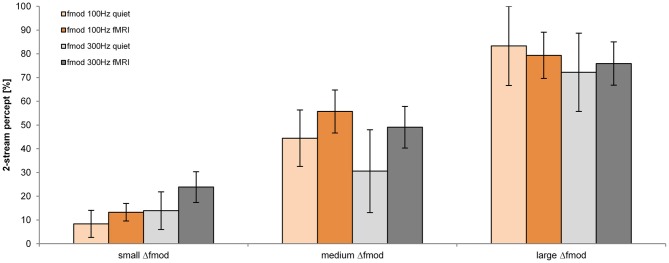
Proportions of a 2-stream percept (mean and s.e.m.) are shown for the fmod A of 100 Hz (orange) and 300 Hz (gray) for the measurements in quiet (lighter coloring: n = 6) and during fMRI (darker coloring: n = 13) for all Δfmod conditions.

Proportions of a 2-stream percept (mean and s.e.m.) are shown for the fmod A of 100 Hz (orange) and 300 Hz (gray) for the measurements in quiet (lighter coloring: n = 6) and during fMRI (darker coloring: n = 13) for all Δfmod conditions.