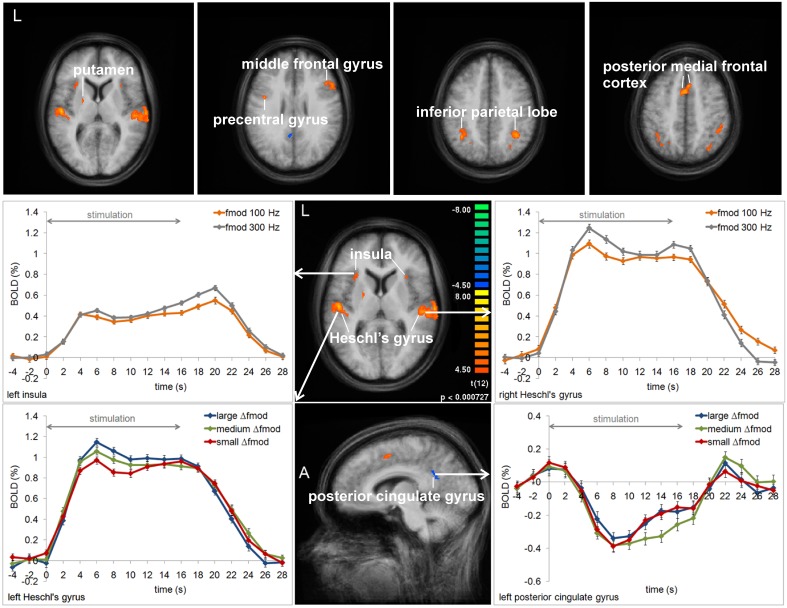
Figure 5.
Group average activation maps (13 subjects) and BOLD signal time courses within regions of interest in Experiment 1. The maps depict all brain regions showing positive or negative deflections of the BOLD signal in at least one of the three Δfmod conditions compared to the baseline (t = 4.5, p < 0.002) for each of the two fmod A (100, 300 Hz). Several regions that showed significant differences between conditions and fmod A variants are labeled and the respective averaged BOLD signal time courses are assigned. Error bars represent SEM.

