Figure 7.

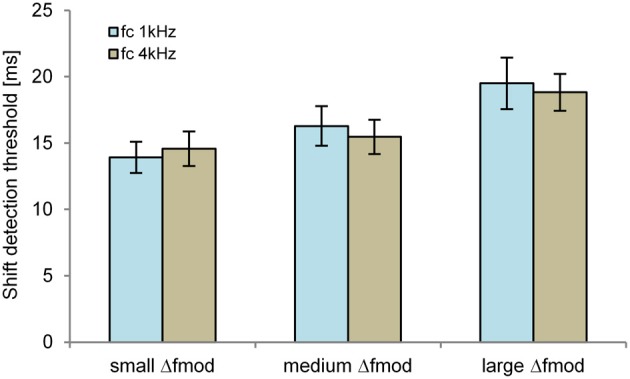
Shift detection thresholds of the B SAM tone (n = 6; mean and SEM) are shown for the fc of 1 kHz (blue) and 4 kHz (brown) for all Δfmod conditions.

Shift detection thresholds of the B SAM tone (n = 6; mean and SEM) are shown for the fc of 1 kHz (blue) and 4 kHz (brown) for all Δfmod conditions.