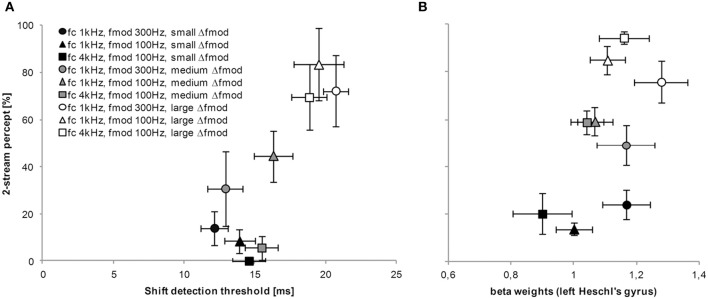
Figure 9.

Relationship between tasks and measures of stream segregation. The graph in (A) represents the proportion of a 2-stream percept for all tested Δfmod stimulus conditions obtained in the subjective psychophysical task (y-axis) and the matching shift detection threshold obtained in the objective psychophysical task (x-axis). (B) For the purpose of comparison and as an example, the proportion of a 2-stream percept for all tested Δfmod stimulus conditions obtained during fMRI (y-axis) is related to the strength of BOLD responses (beta weights) in left Heschl's gyrus (x-axis). The symbols represent the three possible combinations of fc, fmod A, and Δfmod (see legend for values). Generally, the shading of the symbol represent the Δfmod stimulus condition; The darkest shading represent values for the small Δfmod stimulus condition, whereas the lightest shading represent values for the large Δfmod stimulus condition. Mean and error bars (SEM) are presented.
