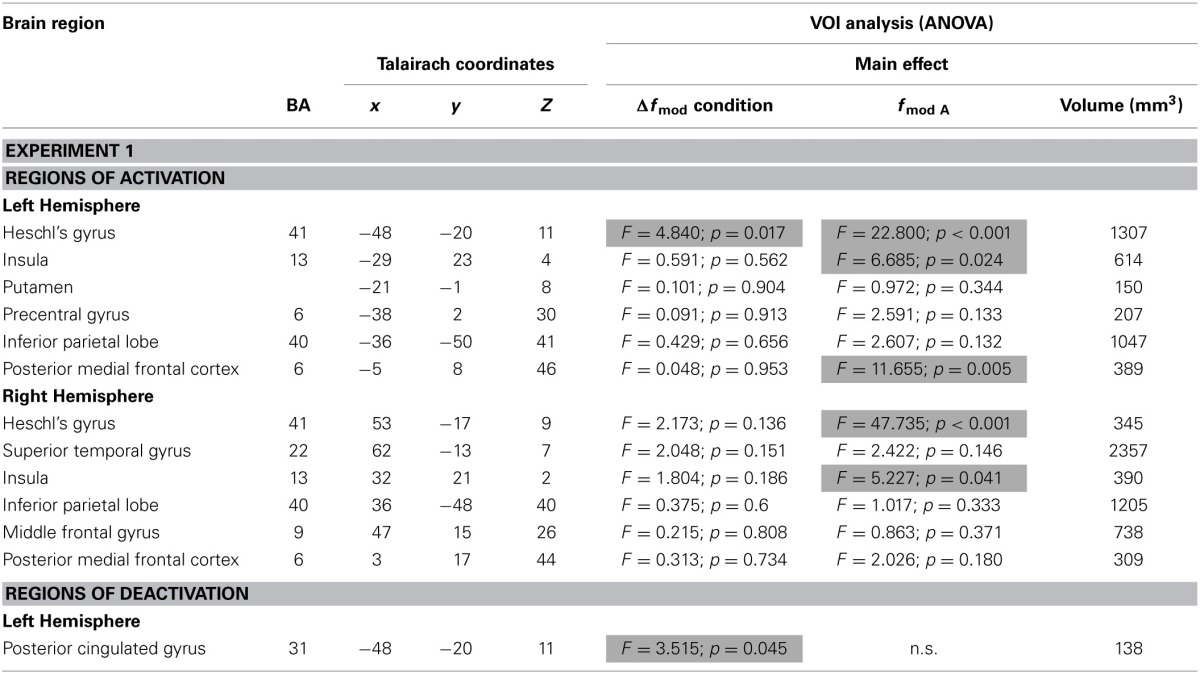
Table 2.
Brain regions (BA-Brodmann area; x,y,z-Talairach coordinates) showing positive or negative deflections of the BOLD signal in at least one of the three Δfmod conditions compared to the baseline (t ≥ 4.5, p < 0.002) for each of the two fmod A (100, 300 Hz) tested in Experiment 1 and the results of ANOVAs within the resulting VOIs.

Significant effects are highlighted in gray.
