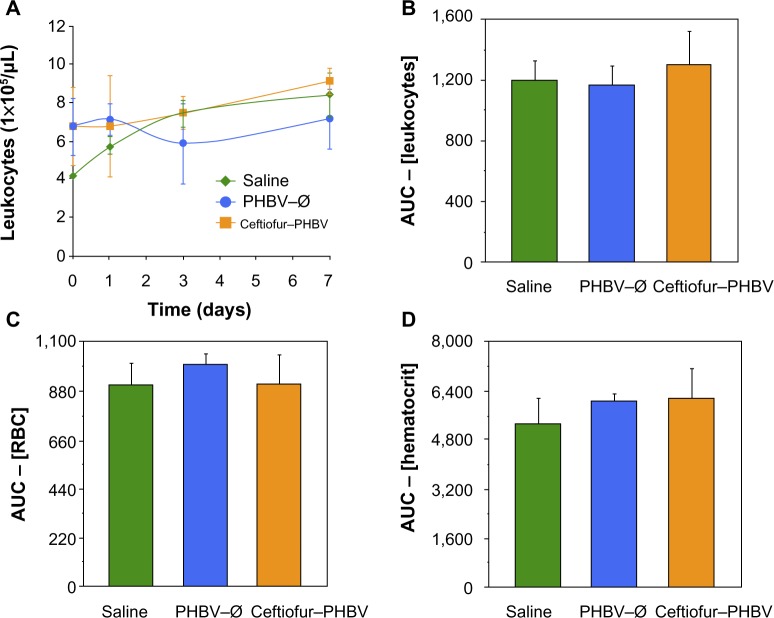
Figure 3.
(A) Leukocyte count at 0, 1, 3, and 7 days in the different study groups (saline, PHBV–Ø and ceftiofur–PHBV). (B) Comparison of the area under the curve (AUC) the values of the leucocyte counts 0, 1, 3, and 7 days. (C and D) Other hematological blood parameters evaluated in this study (P>0.05, Kruskal–Wallis).
Abbreviations: PHBV, poly(3-hydroxybutyrate-co-3-hydroxyvalerate); PHBV–Ø, empty microparticles.

