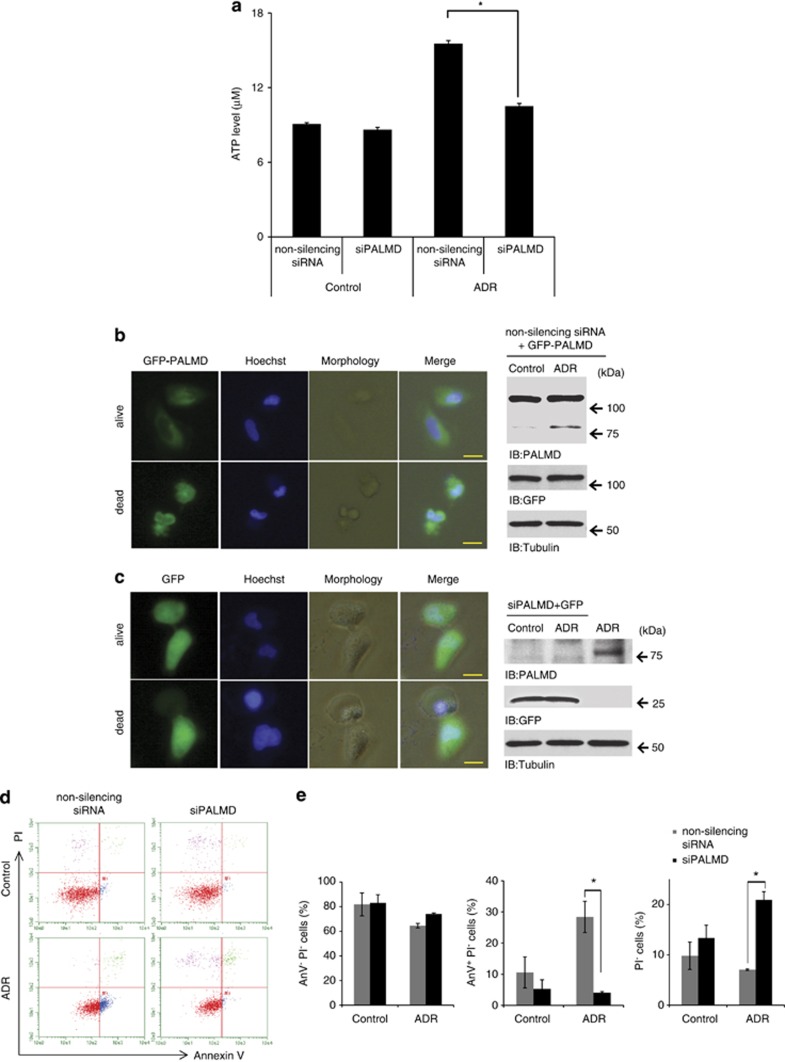
Figure 4.
Loss of PALMD causes necroptosis-like cell death in response to DNA damage through ATP depletion. (a) ATP concentration in PALMD-depleted cells. U2OS cells were transfected with non-silencing siRNA or siPALMD-1 (siPALMD) and treated or left untreated with ADR. The data represent the mean±S.D. from three independent experiments, each performed in triplicates. *P<0.01. (b, left) Cell death morphology in PALMD-overexpressing cells. U2OS cells were co-transfected with green fluorescent protein (GFP)-tagged PALMD and non-silencing siRNA and treated with ADR. The morphologies of the cell death were illustrated by time-lapse imaging and cell image was captured at 5-min intervals from treatment. Upper panels present illustration of the cells just after treatment (alive) and lower panels show cell death (dead). The nuclei were stained with Hoechst. The scale bars indicate 20 μm. (b, right) The transfection efficiency of GFP-PALMD and non-silencing siRNA was monitored. Cell lysates were immunoblotted with anti-PALMD, anti-GFP, or anti-tubulin. (c, left) Cell death morphology in PALMD-depleted cells. U2OS cells were co-transfected with GFP vector and siPALMD-1. Further procedure was performed as described in b. (d) PALMD-involved cell death was confirmed by fluorescence-activated cell sorting analysis. U2OS cells were transfected with non-silencing siRNA or siPALMD-1 (siPALMD), and treated or left untreated with ADR. Cells were double stained with PI and AnV. PI−AnV− populations were defined as viable cells, PI−AnV+ populations were identified as apoptotic and PI-positive populations indicated as necrotic/necroptotic cells. (e) Percentage of viable (left panel), apoptotic (middle panel), or necrotic/necroptotic (right panel) cells from the data described in d was calculated. The data represent the mean±S.D. from three independent experiments. *P<0.01

