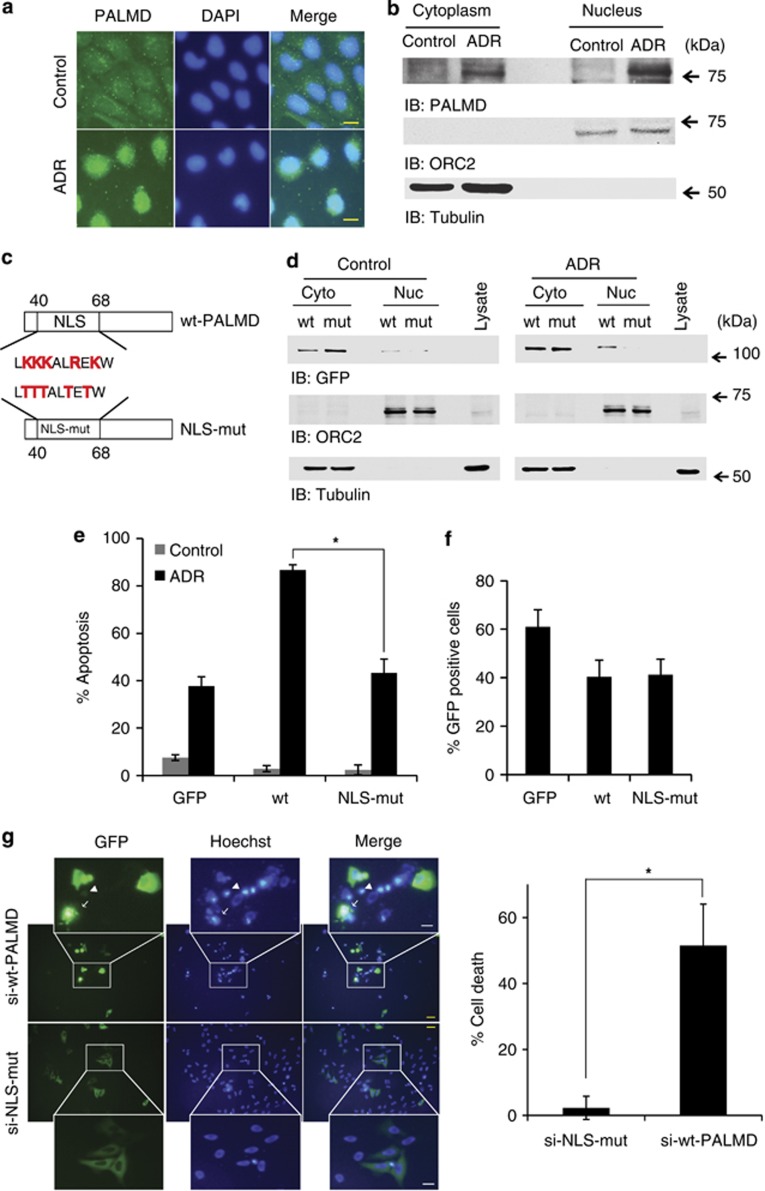
Figure 5.
Accumulation of PALMD is required to induce apoptosis. (a) PALMD localization by immunoflourescence in U2OS cells in normal condition (upper panels) and in stressed condition by ADR (lower panels). U2OS cells were seeded in four-well chamber slides and treated or left untreated with ADR. The nuclei were stained with DAPI. The scale bars indicate 20 μm. (b) PALMD localization by the subcellular fractionation assay. U2OS cells were treated or left untreated with ADR and fractionated as cytoplasmic and nucleic fractions. Both fractions were immunoblotted with anti-PALMD (top panel), anti-ORC2 (second panel), or anti-tubulin (bottom panel). (c) The map of the NLS construct. To design mutant NLS (NLS-mut), arginine and lysine indicated in red within NLS region of wild-type PALMD (wt-PALMD) were substituted with threonine and tagged to the green fluorescent protein (GFP) vector. (d) Subcellular fractionation assay of wt-PALMD and NLS-mut-transfected-cells. U2OS cells were transfected with wt-PALMD (wt) or NLS-mut. Cells were treated (ADR, right panels) or left untreated with ADR (control, left panels) and incubated for 24 h. Cell lysates were fractionated into cytoplasmic (Cyto) and nucleic (Nuc) fractions. Immunoblotting was performed using anti-GFP (top panel), anti-ORC2 (middle panel), or anti-tubulin (bottom panel). (e) Apoptotic assay of wt-PALMD or NLS-mut-transfected cells. U2OS cells were transfected with empty GFP vector (GFP), wt-PALMD (wt) or NLS-mut. Cells were treated with ADR and incubated for 6 h. The percentage of apoptotic cells was quantified with TUNEL (terminal deoxynucleotidyl transferase dUTP nick end labeling)-positive cells. (f) Transfection efficiency of GFP, wt-PALMD, or NLS-mut. (g) Cells undergo death with wt-PALMD or NLS-mut transfection when endogenous PALMD is depleted. The siRNA resistant-PALMD (si-wt-PALMD) or NLS-mut (si-NLS-mut) were co-transfected with siPALMD-1 and incubated for 24 h. The nuclei were illustrated with Hoechst. Cell death was defined with cell blebbings and apoptotic body (arrow), and chromatin condensation (arrow head). The scale bars indicate 40 μm (yellow) or 10 μm (white). The percentage of the cell death in GFP-positive cells is shown in the right panel. The data represent the mean±S.D. from three independent experiments, each performed in triplicates. *P<0.01

