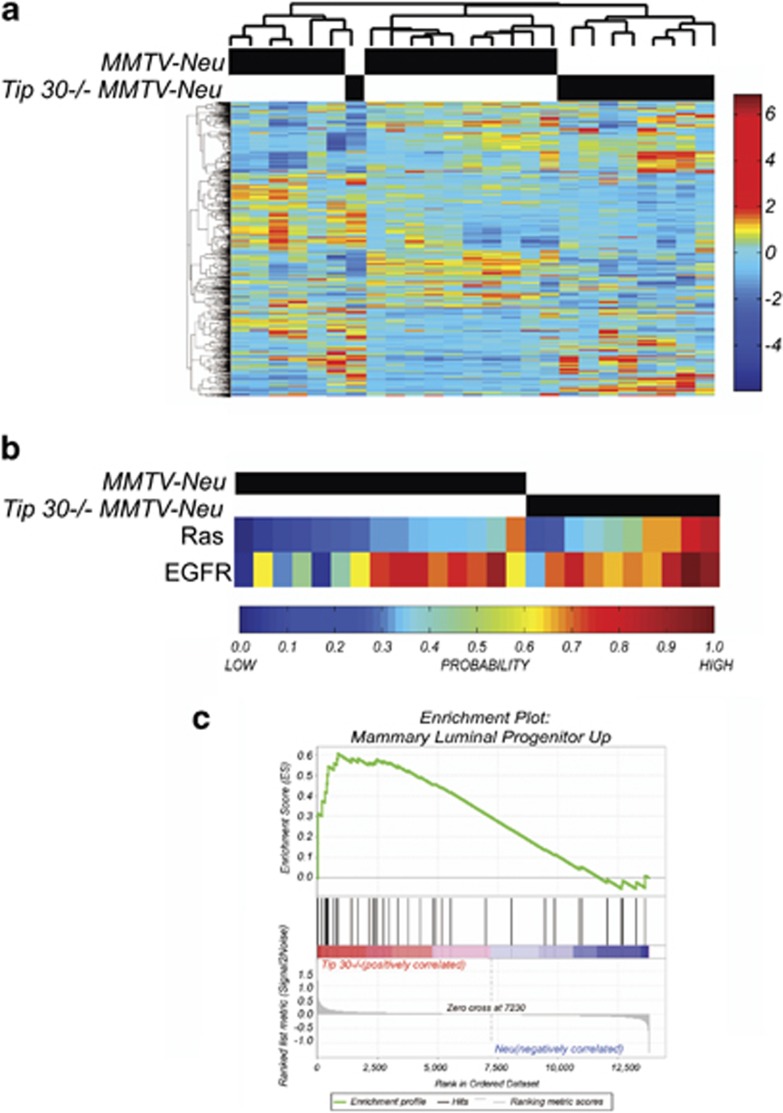
Figure1.
Comparison of gene expression profiles of Tip30−/−/MMTV-Neu tumors with MMTV-Neu tumors. (a) Unsupervised hierarchical clustering illustrating the relationships between Tip30+/+MMTV-Neu tumors (n=15) and Tip30−/−MMTV-Neu tumors (n=9). (b) Gene signature predictions for Ras signal pathway activation and EGFR signal pathway activation in Tip30+/+MMTV-Neu tumors (n=15) and Tip30−/−MMTV-Neu tumors (n=9). (c) GSEA enrichment plot of Tip30−/−MMTV-Neu tumors by utilizing luminal progenitor gene signature. Values above 0 indicate increased enrichment of the gene signature, whereas values below 0 indicate a loss in enrichment. Vertical black lines represent individual genes in the luminal progenitor gene set that contribute to the enrichment score. Genes illustrated by the gray bar are ranked by fold change differences between Tip30−/−MMTV-Neu tumors and Tip30+/+MMTV-Neu tumors. The heatmap below the black vertical lines illustrate the direction of fold change where genes in red have the highest positive fold change and genes in the blue region have the most negative fold change

