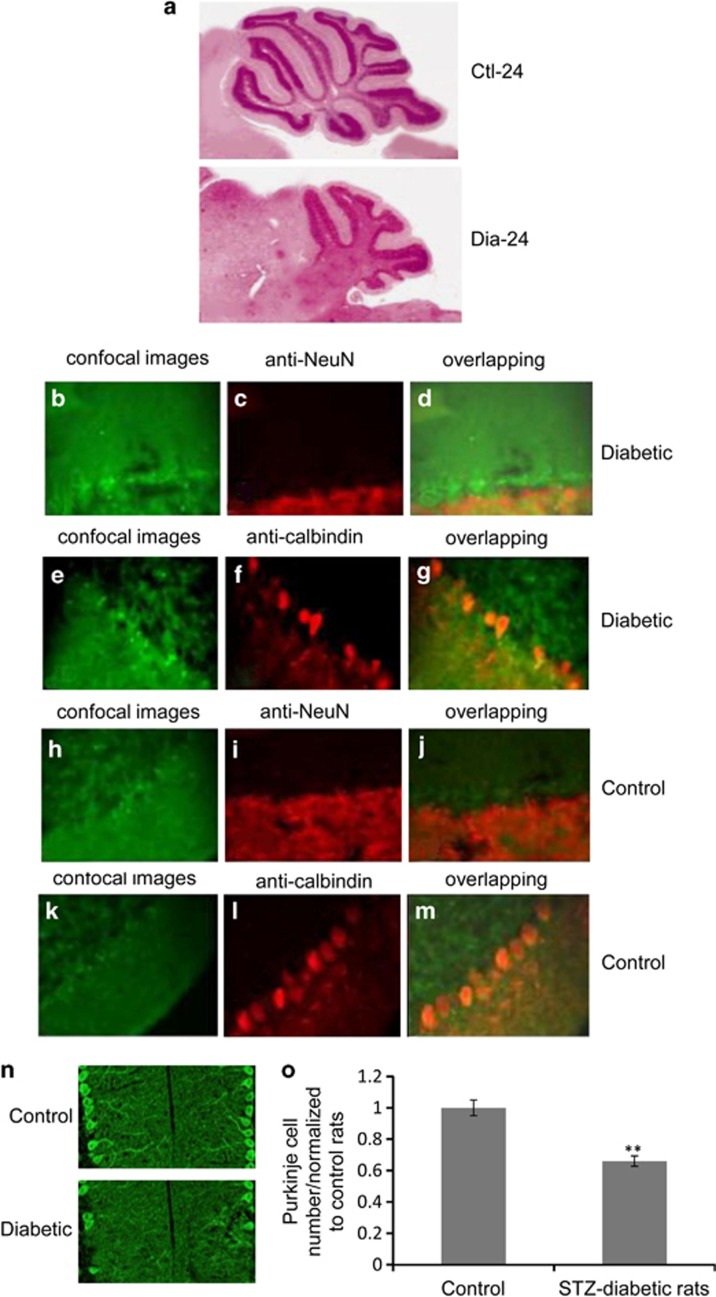
Figure 4.
The degeneration and loss of Purkinje cells in 24-week STZ-diabetic rats. (a) Hematoxylin and eosin-stained midsagittal cerebella. (b and e) Representative confocal images showed the redistribution of green foci in the Purkije cells of STZ-diabetic rats (n=6/group). (c) Immunofluorescent staining with monoclonal anti-NeuN antibody in STZ-diabetic rats. (f) Immunofluorescent staining with monoclonal anti-Calbindin antibody in STZ-diabetic rats. (d) Overlapping of green fluorescence with red immunofluorescent staining of monoclonal anti-NeuN in STZ-diabetic rats. (g) Overlapping of green fluorescence with red immunofluorescent staining of anti-Calbindin in STZ-diabetic rats. (h and k) Representative confocal images showed the redistribution of green foci in the Purkinje cells of control rats. (i) Immunofluorescent staining with monoclonal anti-NeuN antibody in control rats. (l) Immunofluorescent staining of monoclonal anti-Calbindin antibody in control rats. (j) Overlapping of green fluorescence with red immunofluorescent staining of monoclonal anti-NeuN in control rats. (m) Overlapping of green fluorescence with red immunofluorescent staining of anti-Calbindin in control rats. (n) Representive presence of Purkinje cell loss in the DCN in two groups by Calbindin/Alexafluor488 (green). (o) Quantification of the images of panel (n). Bar, 20 μm. The Purkinje cell number was normalized against values from control rats. Differences between means were analyzed by one-way ANOVA. **P<0.01, significantly different from control rats. Data represent mean±S.D. from 3 to 4 independent experiments

